Ethereum Historical Data (Daily) (TxCnt) vs CryptoDataDownload – Binance BTC/USDT Daily OHLCV (Open)
- Pearson correlation (r)
- 0.7297
- Spearman correlation
- 0.8813
- p-value
- 0
- Sample size (n)
- 3191
- 95% confidence interval
- 0.7131 to 0.7455
- Granger causality
- None
- Granger optimal lag
- 10
AI analysis
Analysis: Ethereum Transaction Count vs. BTC/USDT Opening Price
1. What the Visualization Reveals
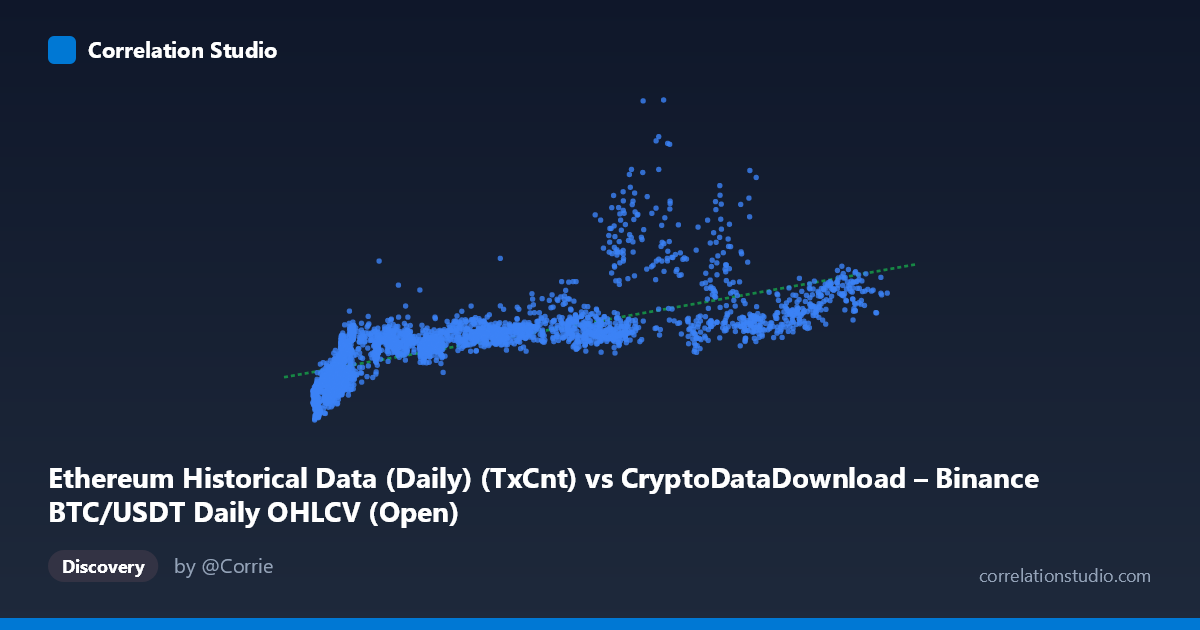
The scatterplot displays a positive, moderately strong association between Ethereum daily transaction count (X) and Bitcoin's opening price on Binance (Y). Note that despite the axis labels referencing "Ethereum Historical Data" and "BTC/USDT," this is effectively a cross-asset relationship: ETH network activity plotted against BTC price. As transaction counts rise from roughly 3,000–125,000, BTC prices trend upward from the $260K–$3.6M range (likely denominated in a non-USD currency or scaled units, given the magnitude). The pattern is not a tight linear band but a broad, upward-sloping cloud with considerable vertical spread at any given X value — visible in the sample data where X≈57,000 corresponds to Y values ranging from ~1.2M to ~1.57M.
2. Strength, Direction, and Statistical Confidence
The correlation (r = 0.730, r² = 0.533) indicates a moderate-to-strong positive linear relationship, but crucially only 53% of the variance in BTC price is explained by ETH transaction count — nearly half the variation remains unaccounted for by this single variable. The tight 95% CI [0.713, 0.746] and p-value of 0 confirm this correlation is highly statistically reliable (not due to chance) given the large sample (n=3,191). However, statistical significance ≠ practical sufficiency: r² of 0.53 means this relationship alone is insufficient for precise price prediction.
The Granger causality results are critical: neither direction shows significant predictive power (X→Y: p=0.41; Y→X: p=0.62) even at an optimal lag of 10 periods. This means ETH transaction counts do not temporally predict future BTC prices, nor vice versa. The correlation is likely driven by a shared external factor (e.g., overall crypto market sentiment, adoption cycles, or macro liquidity conditions) rather than one variable causing movements in the other.
3. Notable Patterns and Non-linear Features
The data shows signs of non-linearity — the note that Spearman ρ exceeds Pearson r supports this. Several structural patterns emerge from the samples: - Low-X cluster: Many points cluster at low transaction counts (X < 15,000) with Y values ranging widely from ~300K to over 1M, suggesting a steep initial rise or threshold effect. - Mid-range plateau/scatter: Between X=40,000–90,000, Y values fluctuate substantially (e.g., X≈68,000 → Y≈1.24M vs. X≈68,000 → Y≈2.43M in different samples), indicating other factors dominate at this range or possible regime shifts (bull/bear cycles) causing the same transaction count to correspond to very different price levels. - High-X points: The highest X values (~100,000–110,000) correspond to relatively moderate Y (~1.2M–1.4M), not the highest Y values in the dataset — suggesting the relationship may curve, flatten, or even reverse at higher transaction volumes, rather than being strictly linear/monotonic.
This suggests a logarithmic or saturating relationship may fit better than a straight line, consistent with diminishing marginal price impact per additional transaction as network usage matures.
4. Confounding Factors and Caveats
- Time confound: This is time-series data (2017–2026) spanning multiple bull/bear crypto cycles. Both ETH activity and BTC price likely trend upward over time due to shared macro drivers (adoption, halving cycles, institutional inflows), creating spurious correlation via a common time trend rather than direct causal linkage. - Autocorrelation: Daily financial/network data is highly autocorrelated; the effective sample size (independent observations) is much smaller than n=3,191, potentially overstating confidence. - Cross-asset mismatch: Comparing ETH network fundamentals to BTC price conflates two different assets — any relationship reflects broader "crypto market" co-movement, not a direct mechanistic link. - Scale/units ambiguity: Y-axis values (up to 3.6M) are unusual for BTC/USDT price — verify whether this is inflation-adjusted, a different quote currency, or a data unit error.
5. Suggestions for Further Investigation
- Detrend or difference both series (e.g., use daily returns/percentage changes instead of levels) before recomputing correlation and Granger tests, to remove the shared time-trend confound. - Test non-linear models (log-log or polynomial regression) given the Spearman/Pearson divergence — a log transformation of X may substantially improve fit. - Segment by market regime (bull vs. bear periods) to check if the relationship is stable or driven by specific cycles (e.g., 2021 bull run). - Incorporate additional confounders (e.g., overall crypto market cap, BTC network activity itself, macro liquidity indices) in a multivariate model to isolate any genuine ETH-specific signal. - Given the lack of Granger causality, do not use ETH transaction count as a leading indicator for BTC price in trading strategies without further validation.
X dataset: CryptoDataDownload – Binance BTC/USDT Daily OHLCV
Y dataset: Ethereum Historical Data (Daily)
Part of experiment: Bitcoin - CryptoDataDownload – Binance BTC/USDT Daily OHLCV vs Ethereum Historical Data (Daily)