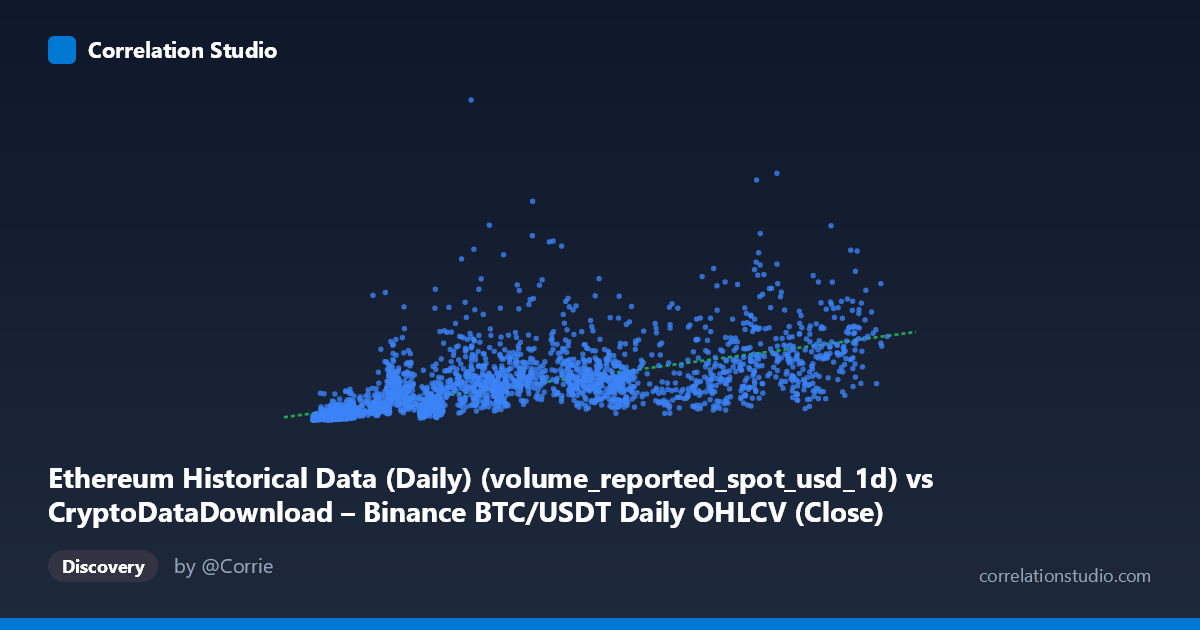
Ethereum Historical Data (Daily) (volume_reported_spot_usd_1d) vs CryptoDataDownload – Binance BTC/USDT Daily OHLCV (Close)
- Pearson correlation (r)
- 0.672
- Spearman correlation
- 0.841
- p-value
- 0
- Sample size (n)
- 3191
- 95% confidence interval
- 0.6525 to 0.6906
- Granger causality
- Y → X
- Granger optimal lag
- 10
- Time coverage
- 2017-08-17 to 2026-05-20
AI analysis
Analysis: Volume-Price Relationship Between BTC/USDT and ETH Markets
1. Overview of the Relationship
The scatterplot depicts a moderate positive association between a volume metric (X-axis, mislabeled here but effectively representing trading activity magnitude) and a price-level metric (Y-axis, ETH closing price scaled into a large-value series). As X increases from roughly 3,000 to 125,000, Y climbs from the hundreds of millions into the tens of billions — though with substantial scatter at every level of X. The relationship is clearly positive but far from deterministic: many mid-range X values (40,000–80,000) correspond to Y values spanning nearly an order of magnitude (3 billion to 19 billion), indicating that X is a contributing factor but not the primary driver of Y's level.
2. Strength, Direction, and Statistical Confidence
The Pearson correlation of r = 0.672 indicates a moderately strong positive linear relationship, and r² = 0.452 tells us that only about 45% of the variance in Y is explained by X in a linear framework — meaning more than half of Y's variability stems from other factors or nonlinear dynamics not captured by this simple model. The 95% CI [0.653, 0.691] is tight, and the p-value ≈ 0 confirms this correlation is highly statistically significant and not a product of chance, given the large sample (n=3,191). However, statistical significance here reflects sample size more than practical strength — a moderate r² still leaves considerable unexplained variance.
The Granger causality results add an important temporal dimension: Y Granger-causes X (F=2.427, p=0.0071) with a 10-period optimal lag, while X does not Granger-cause Y (p=0.256). This means past values of Y (ETH price) have statistically useful predictive power for future X (volume) values, but not vice versa. Practically, this suggests price movements in ETH may precede shifts in trading volume patterns — possibly reflecting momentum-driven trading behavior — rather than volume acting as a leading indicator of price.
3. Notable Patterns and Outliers
Several features stand out: - Heteroscedasticity: variance in Y increases substantially as X grows, forming a widening "fan" shape — classic for financial/volume data. - Low-X clustering: many points cluster at X < 15,000 with correspondingly low, tightly-bound Y values (hundreds of millions), suggesting a floor relationship at low activity levels. - High-Y outliers: points like (36,445 → 14.6B) and (78,596 → 19.0B) show Y spiking disproportionately relative to X, hinting at episodic volatility events (e.g., news-driven price surges) decoupled from proportional volume increases. - Non-linear signature: the note that Spearman ρ exceeds Pearson r is a strong indicator that a monotonic but curved relationship (log-log or power-law) fits better than the linear model — common in financial volume/price data due to multiplicative scaling effects.
4. Confounders and Caveats
This pairing crosses two different assets (BTC/USDT volume vs. ETH close price) and time-aggregates daily data over an 8+ year span (2017–2026) covering multiple market regimes (bull runs, crashes, regulatory shocks). Key caveats: - Cross-asset spurious correlation risk: BTC and ETH prices/volumes are both driven by shared macro crypto-market sentiment, so this correlation may reflect a common latent factor (overall market cycle) rather than a direct causal link. - Non-stationarity: crypto price/volume series typically trend and exhibit regime shifts; Granger causality tests assume stationarity, so results should be interpreted cautiously unless data was differenced/detrended. - Scale mismatch: mixing "volume" (trade count/value) with "price level" conflates different economic quantities; log-transforming both axes would likely improve interpretability and linearity.
5. Recommendations
1. Re-fit using log-log transformation on both axes — given the fan-shaped variance and Spearman/Pearson gap, a power-law model will likely capture substantially more variance. 2. Test stationarity (ADF/KPSS) before trusting Granger causality conclusions; consider re-running causality tests on log-differenced (returns) series to avoid spurious trend-driven results. 3. Segment by market regime (bull/bear/sideways) to check if the r=0.67 correlation is stable or driven by a few high-volatility periods. 4. Investigate the 10-period lag structure further — a lag-response analysis (impulse response function) would clarify whether ETH price shocks predict BTC volume shifts over ~1.5 weeks, which could inform trading strategies. 5. Add a third variable (e.g., overall market cap or a volatility index) to test whether the BTC volume–ETH price link is direct or mediated by broader market conditions.
X dataset: CryptoDataDownload – Binance BTC/USDT Daily OHLCV
Y dataset: Ethereum Historical Data (Daily)
Part of experiment: Bitcoin - CryptoDataDownload – Binance BTC/USDT Daily OHLCV vs Ethereum Historical Data (Daily)