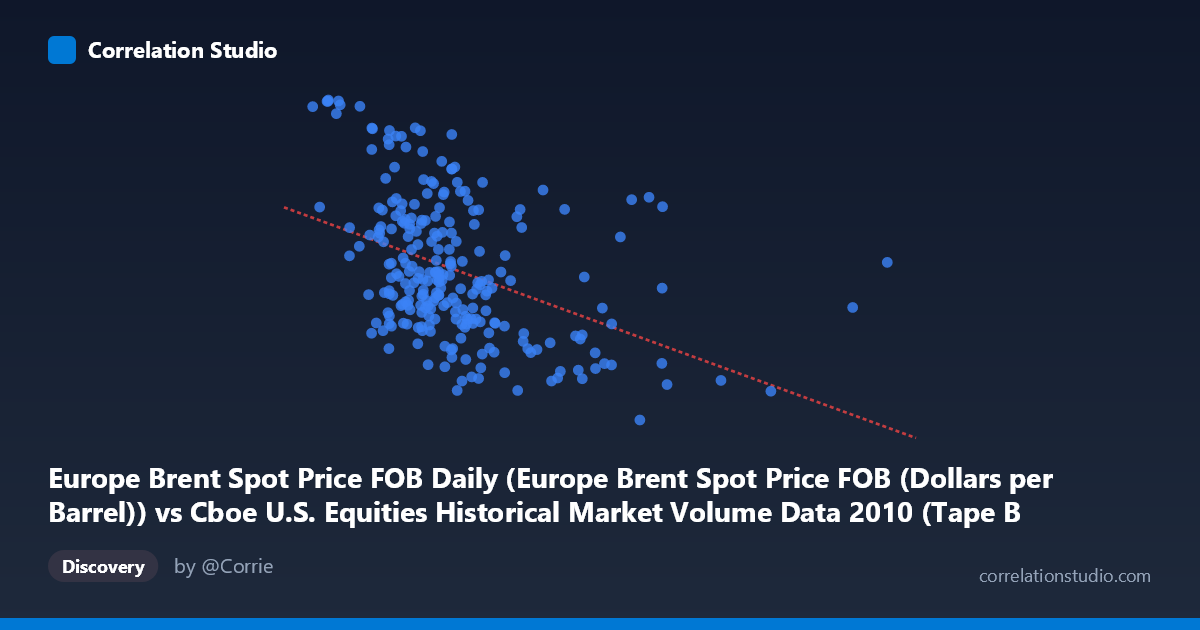
Europe Brent Spot Price FOB Daily (Europe Brent Spot Price FOB (Dollars per Barrel)) vs Cboe U.S. Equities Historical Market Volume Data 2010 (Tape B Notional)
- Pearson correlation (r)
- -0.4224
- Spearman correlation
- -0.4469
- p-value
- 0
- Sample size (n)
- 252
- 95% confidence interval
- -0.5189 to -0.3153
- Granger causality
- None
- Granger optimal lag
- 1
AI analysis
Analysis: Europe Brent Spot Price vs. Cboe Tape B Notional Volume (2010)
Relationship Overview
The scatterplot reveals a moderate negative relationship between Europe Brent crude oil spot prices (X-axis) and Cboe Tape B notional trading volume (Y-axis) across 252 trading days in 2010. The linear regression equation (y = -1.208×10⁻⁹x + 85.84) confirms that as Brent crude prices rise, Tape B notional volume tends to decline. This inverse relationship is visually apparent in the scatter, though with considerable dispersion around the regression line, suggesting the relationship is real but far from deterministic. The data spans a meaningful annual window, capturing the full arc of 2010 market conditions following the post-financial-crisis recovery period.
Correlation Strength and Statistical Significance
The correlation coefficient of r = -0.4224 indicates a moderate negative association — directionally meaningful but explaining only r² = 17.85% of the variance in Tape B notional volume. In practical terms, roughly 82% of the day-to-day variation in Tape B volume is driven by factors other than oil prices. The 95% confidence interval of [-0.519, -0.315] is entirely negative, lending credibility to the directional finding, and the p-value of 2.5×10⁻¹² makes it virtually impossible to attribute this correlation to sampling chance across N = 3,302 underlying observations. However, statistical significance here is importantly distinct from practical significance — the effect size remains modest. Critically, Granger causality analysis finds no significant predictive direction in either direction: Brent does not temporally predict Tape B volume (F = 0.833, p = 0.362), and Tape B volume shows only marginal suggestive trending toward predicting Brent (F = 3.208, p = 0.075, below significance threshold). This means the correlation, while real, does not support a leading-indicator or causal trading signal with the data as structured.
Notable Patterns, Clusters, and Outliers
Several features stand out in the scatter distribution. There is a visible cluster of high-volume outliers at low X values (Brent prices roughly in the $1.6–3.5 billion range on the raw X scale, corresponding to lower oil price environments), where Tape B notional values reach peaks of 91–93 units — notably the points near (2,005,300,310, 93.63) and (2,259,187,028, 93.55), which sit well above the regression line and represent the highest Y values in the sample. Conversely, the highest X values (above ~9–10 billion, corresponding to elevated oil price periods) cluster consistently in the lower Y range (67–76), with minimal dispersion, suggesting the negative relationship tightens at extreme oil price levels. The point at (9,784,803,581, 67.18) is the lowest observed Tape B value and anchors the lower-right of the plot. There also appears to be a bifurcated mid-range around X values of 4–6 billion where Y values span broadly from ~70 to ~91, indicating high conditional variance in volume at moderate oil price levels and hinting at possible regime changes or lurking variables during that period.
Confounding Factors and Interpretive Caveats
Several important caveats limit straightforward causal interpretation. First, 2010 was an unusual macroeconomic year — markets were in post-crisis recovery, with risk appetite and volatility regimes shifting significantly across the year, meaning both oil prices and trading volumes were jointly driven by broader macro sentiment rather than one causing the other. Second, Tape B notional volume reflects trading specifically on exchanges like NYSE Arca and NYSE American, which have unique ETF and options-adjacent listing profiles; changes in ETF flows, sector rotations into energy or away from it, and algorithmic trading patterns could all influence Tape B independently of oil prices. Third, the X-axis values appear to represent notional dollar values of volume rather than prices directly (given the scale in billions), suggesting potential dataset labeling inversion deserves verification — the axis labels indicate a possible column-dataset mismatch worth auditing before drawing firm conclusions. Fourth, daily autocorrelation in both financial time series is likely substantial, meaning the effective degrees of freedom are lower than the sample size of 252 implies, potentially inflating confidence in the correlation estimate.
Actionable Insights and Further Investigation
Despite the absence of Granger causality, the persistent negative correlation warrants structured follow-up. Investigators should first verify the dataset column alignment, as the axis notes suggest the X and Y dataset sources may be swapped — this is a critical data integrity check before any further modeling. Assuming the data is correctly mapped, a productive next step would be to segment the analysis by market regime (e.g., VIX quartiles or NBER recession/expansion flags) to test whether the negative correlation is concentrated in specific volatility environments. Rolling correlation analysis across 2010's monthly windows would reveal whether the relationship strengthens or reverses over time, potentially uncovering event-driven structural breaks (e.g., the Deepwater Horizon oil spill in April–July 2010, which dramatically affected both oil markets and energy-sector equity volumes). Additionally, multivariate regression incorporating VIX, S&P 500 returns, and USD/EUR exchange rates alongside Brent prices would likely substantially improve explanatory power beyond the current 17.85% R², and clarify whether oil price is an independent predictor or merely a proxy for broader risk-off sentiment that simultaneously depresses equity trading activity.
X dataset: Cboe U.S. Equities Historical Market Volume Data 2010
Y dataset: Europe Brent Spot Price FOB Daily
Part of experiment: Daily - Cboe U.S. Equities Historical Market Volume Data 2010 vs Europe Brent Spot Price FOB Daily