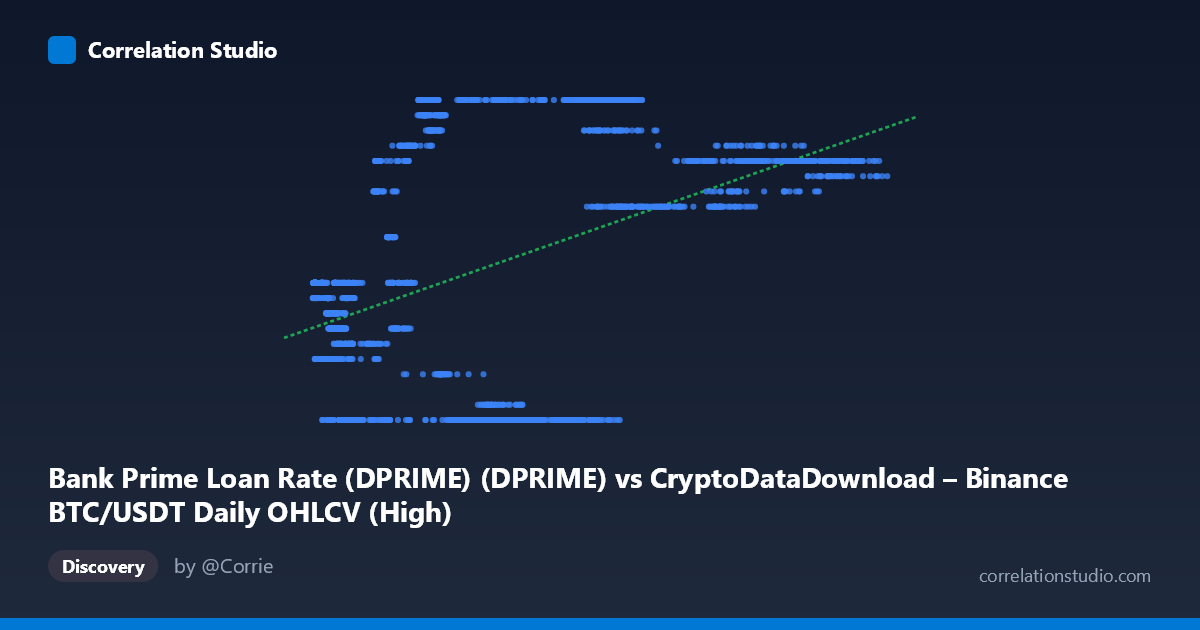
Bank Prime Loan Rate (DPRIME) (DPRIME) vs CryptoDataDownload – Binance BTC/USDT Daily OHLCV (High)
- Pearson correlation (r)
- 0.4641
- Spearman correlation
- 0.3481
- p-value
- 0
- Sample size (n)
- 2227
- 95% confidence interval
- 0.4309 to 0.4961
- Granger causality
- None
- Granger optimal lag
- 1
- Time coverage
- 2017-08-17 to 2026-06-25
- Recomputed on refreshed data
- 2026-10-23 (r was 0.4641)
AI analysis
Analysis: Bank Prime Loan Rate vs. BTC/USDT Daily High
Note on axis labeling: The axis labels appear swapped in the metadata — the values described (3.25–8.50) are clearly bank prime loan rates, while the 3,335–126,199 range corresponds to BTC/USDT price data. This analysis treats X = BTC/USDT High price and Y = Bank Prime Loan Rate, consistent with the data patterns shown.
1. What the Visualization Reveals
The scatterplot shows a moderate positive association between Bitcoin's price level and the U.S. bank prime lending rate over the 2017–2026 period. Rather than a clean linear trend, the data appears to cluster into distinct horizontal bands corresponding to discrete Fed rate regimes (e.g., 3.25%, 5.00%, 6.75%, 7.75%, 8.50%), reflecting the step-function nature of prime rate changes rather than continuous variation. Within each rate band, BTC prices span a wide range, indicating that the relationship is far from deterministic.
2. Strength, Direction, and Statistical Confidence
The correlation coefficient (r = 0.464) indicates a moderate positive relationship, with the regression slope confirming that higher BTC prices coincide with higher prime rates. However, r² = 0.215 means only about 21.5% of the variance in prime rate is explained by BTC price (or vice versa) — the majority (78.5%) is driven by other factors. The 95% CI [0.430, 0.496] is fairly tight, and the p-value (~0) confirms this correlation is highly statistically significant and not due to chance, given the large sample (n=2,221).
Critically, the Granger causality tests show no significant predictive direction in either direction (X→Y: p=0.183; Y→X: p=0.477). This means neither variable reliably helps forecast future movements of the other at a 1-period lag. This is an important caveat: statistical correlation and significance do not imply temporal predictability or causation here — the relationship may instead stem from both variables trending over the same macroeconomic era rather than one driving the other.
3. Notable Patterns and Structural Features
The most striking feature is the banding/stratification in Y values — prime rate moves in discrete steps set by Fed policy, creating horizontal clusters rather than a smooth continuum. Within the 3.25% band (the near-zero rate era of 2020–2022), BTC prices range enormously (from ~7,000 to over 60,000), showing that during accommodative monetary policy, BTC experienced its most dramatic price action independent of rate levels. Conversely, at higher rate bands (7.75–8.50%, corresponding to 2023–2024 tightening), BTC prices also reach some of their highest values, suggesting BTC continued appreciating despite — not because of — higher rates. This suggests the relationship may be coincidental/time-driven rather than causal (both variables trending upward over the sample period for unrelated reasons: rate hikes due to inflation control, BTC appreciation due to adoption/halving cycles).
4. Confounding Factors and Caveats
This is a classic case of spurious correlation via shared time trend. Both series are non-stationary and generally trended upward over 2017–2026 (BTC due to secular adoption growth and halving cycles; prime rate due to the Fed's post-pandemic tightening cycle). Two independently trending time series will often show significant correlation without any causal link. Additional confounders include: macroeconomic regime shifts (COVID stimulus, inflation, banking crises), crypto-specific events (exchange collapses, ETF approvals, regulatory news) that are unrelated to interest rate policy, and the discrete/administered nature of the prime rate (set periodically by banks following Fed Funds Rate, not a market-determined continuous variable).
5. Suggestions for Further Investigation
1. Detrend or difference both series (e.g., use % changes or first differences) and re-run correlation — this tests whether the relationship survives once the shared time trend is removed, which is essential given the Granger non-causality result. 2. Segment by rate regime and analyze BTC volatility/returns within each band separately, rather than pooling all data — the near-zero-rate period likely behaves very differently from the tightening period. 3. Add other explanatory variables (e.g., DXY dollar index, equity market performance, on-chain BTC metrics) to a multivariate model, since the prime rate alone explains only ~21% of variance. 4. Treat this as a macro-correlation, not a trading signal — given the lack of Granger causality, using prime rate changes to predict BTC price movements (or vice versa) is not statistically supported at a 1-day/period lag.
X dataset: CryptoDataDownload – Binance BTC/USDT Daily OHLCV
Y dataset: Bank Prime Loan Rate (DPRIME)
Part of experiment: Bitcoin - CryptoDataDownload – Binance BTC/USDT Daily OHLCV vs Bank Prime Loan Rate (DPRIME)