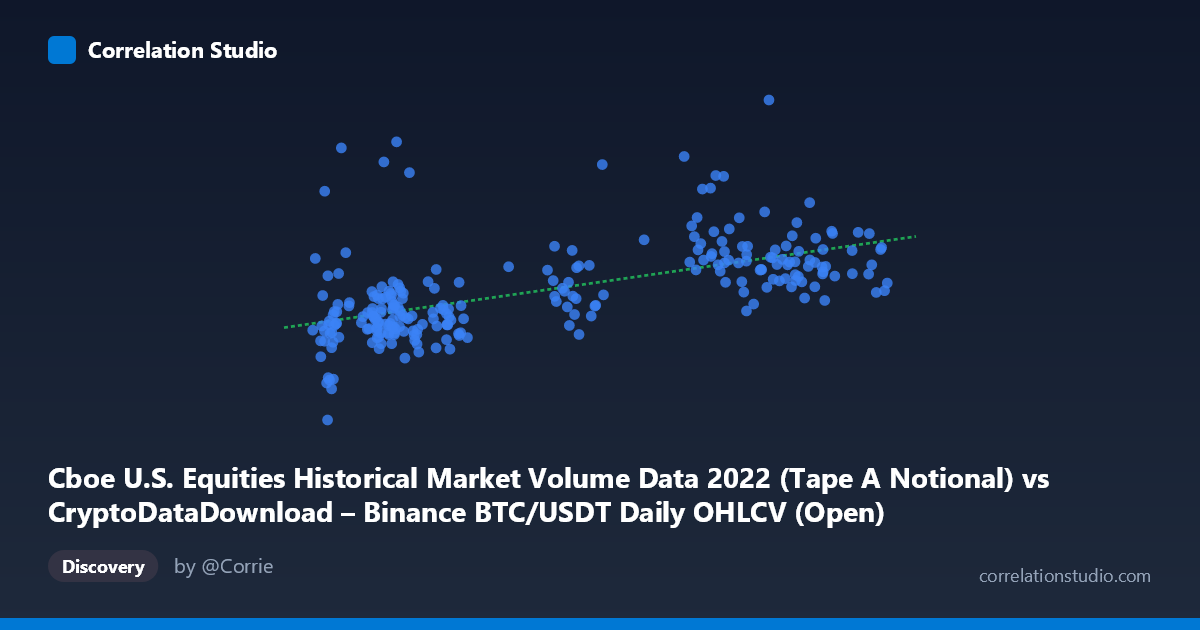
Cboe U.S. Equities Historical Market Volume Data 2022 (Tape A Notional) vs CryptoDataDownload – Binance BTC/USDT Daily OHLCV (Open)
- Pearson correlation (r)
- 0.584
- Spearman correlation
- 0.6394
- p-value
- 0
- Sample size (n)
- 251
- 95% confidence interval
- 0.496 to 0.6601
- Granger causality
- None
- Granger optimal lag
- 10
- Time coverage
- 2022-01-03 to 2022-12-30
AI analysis
Analysis: Cboe Equities Volume vs. Binance BTC/USDT Open Price (2022)
1. What the Visualization Reveals
The scatterplot shows a moderate positive relationship between Cboe U.S. equities trading volume (notional, Tape A) and Binance BTC/USDT opening price across 251 daily observations in 2022. As equities market volume increases, BTC price tends to be higher as well, though the relationship is loose rather than tight — points are scattered widely around the regression line rather than hugging it closely. The data cloud shows considerable vertical spread at nearly every X value, indicating that equities volume alone is a weak predictor of the specific BTC price on any given day.
2. Strength, Direction, and Statistical Confidence
The correlation coefficient (r = 0.584) indicates a moderate positive relationship, with r² = 0.341 meaning only about 34% of the variance in BTC opening price is statistically associated with equities volume — leaving 66% unexplained by this single variable. The 95% CI [0.496, 0.660] is reasonably tight and excludes zero, and the p-value (effectively 0) confirms this correlation is highly unlikely to be due to chance in this sample. However, statistical significance should not be confused with practical predictive power: r² of 0.34 is a modest effect size, suitable for noting an association but not for forecasting.
Critically, the Granger causality tests show no significant predictive direction in either direction (X→Y: p=0.77; Y→X: p=0.99) even at an optimal lag of 10 periods. This means neither variable reliably leads the other in time — the correlation is likely contemporaneous/coincidental rather than causal or even sequentially predictive. Both series may be responding to a shared external driver (e.g., macro risk sentiment) rather than one influencing the other.
3. Notable Patterns and Outliers
Several clusters are visible: a cluster of low-X (~15,800–24,000) points with generally lower, tightly-banded Y values (~$7.5B–10B), and a cluster of high-X (~37,000–47,000) points with more elevated and dispersed Y values (~$11B–20B). Within the high-X cluster there's a notable outlier at X≈40,918 where Y spikes to $20.09B — well above the surrounding points — suggesting a market event (likely a volatility spike, e.g., during the FTX collapse in November 2022) that inflated Cboe volume without a proportional X-axis shift. There are also mid-range X values (~20,000–21,000) with anomalously high Y (~$16-18B), breaking the general trend and suggesting date-specific shocks rather than a smooth functional relationship. This suggests the relationship may be driven by discrete volatility events clustering in time (e.g., Q4 2022 turmoil) rather than a stable linear mechanism throughout the year.
4. Confounding Factors and Caveats
This pairing is unusual: it correlates a crypto exchange metric (BTC price) with a traditional equities market volume metric, on the same calendar dates — but the label names suggest possible metadata mismatch (axis descriptions cross-reference both datasets confusingly). The likely real driver is shared macro conditions in 2022 — rising interest rates, inflation concerns, and risk-off sentiment — which simultaneously suppressed/elevated both equity trading volumes and crypto prices during systemic events (Terra/Luna collapse, FTX implosion). This is a classic case of spurious/confounded correlation via a common cause (macro volatility regime) rather than a direct economic link between equities trading volume and BTC pricing. Additionally, both series exhibit trends over the year (BTC declined broadly in 2022; equity volumes fluctuated with volatility spikes), and shared trending behavior can inflate correlation even without genuine interaction.
5. Actionable Insights
Given the lack of Granger causality, this relationship should not be used for short-term predictive trading strategies. Instead, treat it as evidence of shared macro-volatility exposure: consider adding a common risk-factor proxy (e.g., VIX, DXY, or a crypto volatility index) to a multivariate model to test whether it explains away the residual r² = 0.34. Further investigation should also (a) verify the axis/column mapping is correct given the confusing dataset labels, (b) test the relationship after differencing or detrending both series to remove spurious trend correlation, and (c) isolate/exclude the Nov 2022 event window to see if the correlation holds in "normal" periods versus being an artifact of a few crisis days.
X dataset: CryptoDataDownload – Binance BTC/USDT Daily OHLCV
Y dataset: Cboe U.S. Equities Historical Market Volume Data 2022
Part of experiment: Bitcoin - CryptoDataDownload – Binance BTC/USDT Daily OHLCV vs Cboe U.S. Equities Historical Market Volume Data 2022