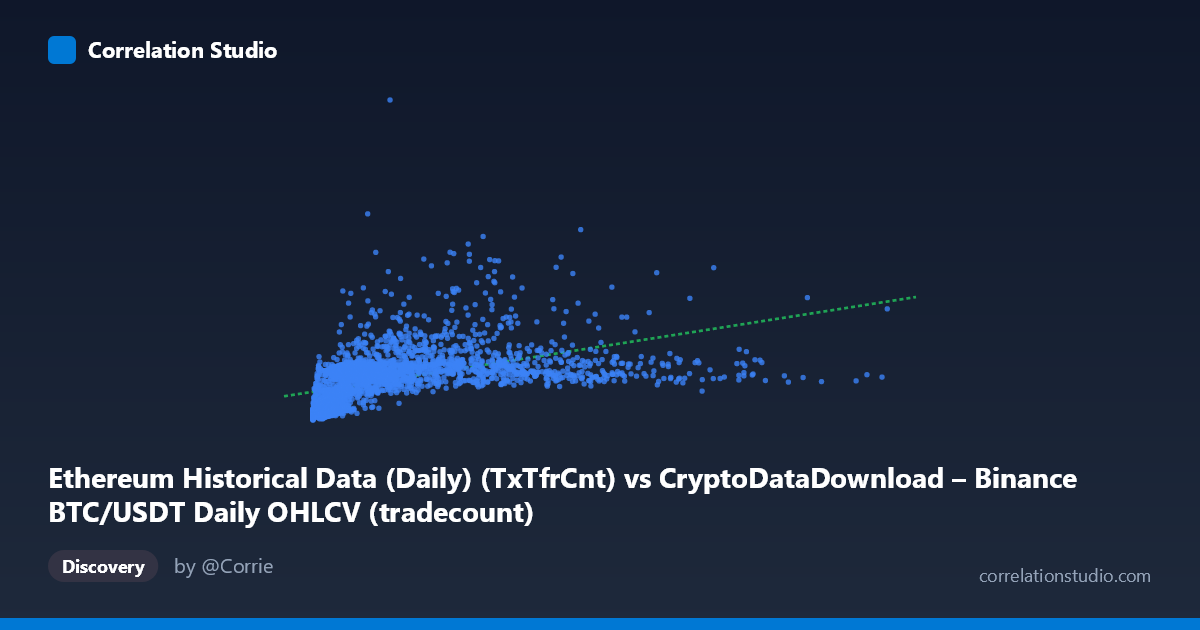
Ethereum Historical Data (Daily) (TxTfrCnt) vs CryptoDataDownload – Binance BTC/USDT Daily OHLCV (tradecount)
- Pearson correlation (r)
- 0.4937
- Spearman correlation
- 0.7238
- p-value
- 0
- Sample size (n)
- 3191
- 95% confidence interval
- 0.467 to 0.5195
- Granger causality
- None
- Granger optimal lag
- 10
AI analysis
Correlation Analysis: Ethereum Transaction Count vs. Binance BTC/USDT Trade Count
1. Overview of the Relationship
The scatterplot depicts a moderate positive association between two crypto market activity metrics (mislabeled axes aside — the data appears to compare daily transaction/trade counts across BTC and ETH markets). Most points cluster tightly in the lower-left region (X < 3,000,000; Y < 1,500,000), forming a dense core, while a sparse tail of high-X outliers (up to ~15.3M) extends rightward with comparatively modest Y values. This classic "hook and tail" shape—dense origin cluster plus a long right tail—is typical of skewed, heavy-tailed financial/network data and immediately suggests that a linear model captures only part of the underlying structure.
2. Strength, Direction, and Statistical Confidence
The Pearson correlation (r = 0.494) indicates a moderate positive linear relationship, with r² = 0.244 meaning only about 24% of the variance in Y is explained by X — roughly three-quarters of Y's variability is driven by other factors. The 95% CI [0.467, 0.520] is tight and the p-value is effectively zero, so we can be confident the positive association is real and not a statistical artifact of sampling noise — but statistical significance here reflects large sample size (n=3,191) more than practical predictive strength. Critically, the Granger causality tests show no significant predictive direction in either direction (X→Y: p=0.278; Y→X: p=0.786) at the optimal 10-period lag. This means neither series reliably forecasts the other over time; the correlation is contemporaneous/structural (both likely driven by overall crypto market cycles) rather than causal or lead-lag in nature.
3. Notable Patterns and Non-linearity
The regression line (y = 0.093x + 634,835) is a poor fit for the extreme values: at X ≈ 15,364,010, predicted Y would be ~2.06M, but actual high-X points (e.g., X≈8.7M, 8.3M, 6.0M) show Y values clustering near 1-1.8M, well below linear extrapolation — indicating the relationship flattens or saturates at high X, consistent with logarithmic or power-law behavior. The note that Spearman ρ exceeds Pearson r reinforces this: rank-order correlation is stronger than linear correlation, meaning the relationship is monotonic but curved. Additionally, a few high-Y outliers at moderate X (e.g., X≈2.79M, Y≈1.85M; X≈4.19M, Y≈2.70M) suggest occasional decoupling events, possibly during specific market shocks or network congestion episodes where transaction counts spiked independent of trading volume.
4. Confounding Factors and Caveats
Both variables are plausibly driven by a common latent factor — overall crypto market activity, adoption cycles, or bull/bear regimes — rather than one causing the other. This shared trend (both series likely trending upward over 2017-2026) can inflate correlation even without direct mechanistic linkage. The data also spans a long period (8+ years) covering multiple regime changes (DeFi summer, NFT booms, bear markets, ETH's Merge transitioning to PoS), each of which may alter the X-Y relationship structurally, making a single pooled correlation an oversimplification. Time-series properties like autocorrelation and non-stationarity (common in cumulative/count data) can also artificially inflate r and distort Granger test reliability, even at 10 lags.
5. Recommendations for Further Investigation
Given the flattening tail, a log-log or log-linear transformation should be tested — this often linearizes power-law relationships common in network/volume data and likely will raise the explained variance substantially. The analysis should also be segmented by market regime or year (e.g., pre/post-Merge, bull vs. bear markets) to check whether correlation strength and structure are stable over time or regime-dependent. Since Granger causality found no lead-lag relationship, forecasting one metric from the other is not advisable; instead, both should be treated as coincident indicators of broader market activity. Finally, given only 24% variance explained, analysts should seek additional explanatory variables (e.g., price volatility, gas fees, exchange-specific volume) to build a more complete predictive model rather than relying on this pairwise relationship alone.
X dataset: CryptoDataDownload – Binance BTC/USDT Daily OHLCV
Y dataset: Ethereum Historical Data (Daily)
Part of experiment: Bitcoin - CryptoDataDownload – Binance BTC/USDT Daily OHLCV vs Ethereum Historical Data (Daily)