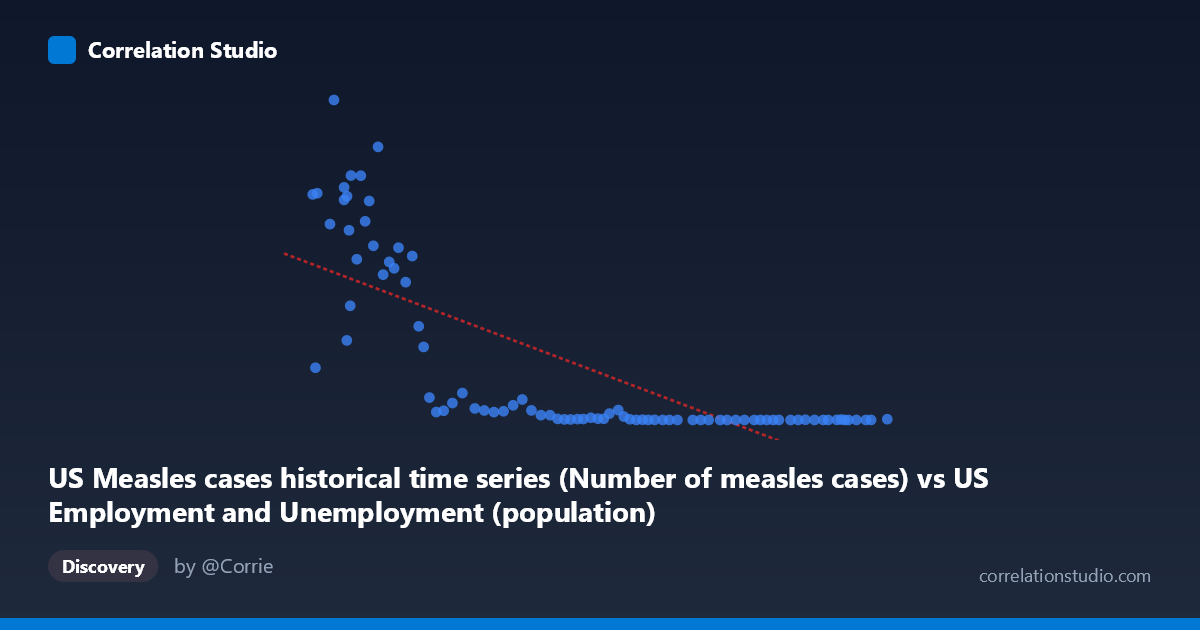
US Measles cases historical time series (Number of measles cases) vs US Employment and Unemployment (population)
- Pearson correlation (r)
- -0.7533
- Spearman correlation
- -0.9129
- p-value
- 0
- Sample size (n)
- 85
- 95% confidence interval
- -0.8328 to -0.6435
- Granger causality
- None
- Granger optimal lag
- 10
- Time coverage
- 1941-01-01 to 2025-01-01
- Recomputed on refreshed data
- 2026-10-18 (r was -0.7533)
AI analysis
Analysis: US Measles Cases vs. US Population (1941–2025)
1. What the Visualization Reveals
The scatterplot displays a striking negative relationship between annual US measles case counts (X-axis) and the US population (Y-axis) over roughly eight decades. As measles cases decline from historically high levels (approaching 300,000+) toward near-zero, the population simultaneously grows from mid-20th century levels toward modern figures. The plot visually bifurcates into two distinct regions: a dense cluster of high-population, near-zero measles points representing the modern vaccination era, and a dispersed arc of lower-population, high-measles points representing the pre-vaccine and early-vaccine decades. This creates a characteristic hyperbolic or L-shaped scatter rather than a clean linear fan, immediately signaling that a simple linear model may not fully capture the underlying structure.
2. Correlation Strength, Direction, and Causality
The Pearson correlation of r = −0.753 (95% CI: [−0.833, −0.644], p ≈ 0) confirms a strong, statistically significant negative association — as measles cases increase, population values are lower, and vice versa. The R² of 0.567 means that approximately 56.7% of the variance in population is "explained" by measles case counts within this linear framework, which is a substantial share but also means roughly 43% of variance remains unexplained. The confidence interval is entirely negative and well away from zero, leaving no meaningful doubt about the direction of the association. However, the Granger causality results are non-significant in both directions (X→Y: F = 1.54, p = 0.15; Y→X: F = 1.55, p = 0.15), meaning neither variable demonstrably temporally predicts the other after accounting for lags up to 10 periods. This is a critical caveat: the correlation is real, but it does not imply a lagged predictive mechanism — both variables are being jointly driven by the passage of time and the historical events associated with it.
3. Notable Patterns, Clusters, and Non-Linearity
Several structural features stand out. First, there is a tight cluster in the lower-left of the X-axis (X < ~120,000, Y ranging from ~150,000 to ~900,000) representing the pre-vaccine and early-vaccine decades where case counts were high and varied enormously — points like (99,900; 894,134) and (113,727; 763,094) are extreme outliers pulling the regression line. Second, there is a dense horizontal band near Y = 0–100,000 across X values from ~180,000 to ~275,000, representing modern years with near-eliminated measles but a growing population that the linear model cannot differentiate well. The note that Spearman ρ exceeds Pearson r confirms the non-linearity: a logarithmic or power-law transformation of measles cases (or population) would almost certainly yield a better fit, as the relationship compresses dramatically at low case counts. The point at (260,329; 13) — the minimum Y value — anchors the modern extreme.
4. Confounding Factors and Interpretive Caveats
The most fundamental caveat is that both variables are proxies for time. Population grows monotonically over the study period, while measles cases collapsed after the 1963 vaccine introduction and CDC elimination campaigns of the early 2000s. The apparent correlation is therefore largely a shared temporal trend — a classic example of spurious correlation driven by a common historical driver (modernization, public health infrastructure, vaccination programs). The axes are also mislabeled in the dataset metadata (measles cases come from the employment dataset and population from the measles dataset), suggesting a data provenance issue worth investigating before drawing firm conclusions. Additionally, the linear regression equation (y = −3.37x + 748,553) produces nonsensical predictions at extreme values, reinforcing that the linear model is a blunt instrument here.
5. Actionable Insights and Further Investigation
Given these findings, several follow-up steps are warranted. First, detrend both time series (e.g., first-differencing or residual analysis against year) before re-computing correlation to isolate any relationship beyond the shared temporal trend. Second, fit a logarithmic or polynomial regression to measles cases, as the Spearman signal strongly suggests a non-linear model would better explain the data structure. Third, verify dataset column assignments — the metadata mixing of employment/unemployment and measles datasets suggests a possible data pipeline error that could invalidate the entire analysis. Fourth, if the goal is epidemiological, incorporate vaccination coverage rates, birth cohort sizes, and outbreak event flags as covariates to build a properly specified model. The absence of Granger causality is actually the most honest result here: it correctly reflects that population size does not cause measles trends nor vice versa — both are artifacts of the same historical timeline, and any policy or scientific inference must account for that confounding structure explicitly.
X dataset: US Employment and Unemployment
Y dataset: US Measles cases historical time series
Part of experiment: Yearly - US Employment and Unemployment vs US Measles cases historical time series