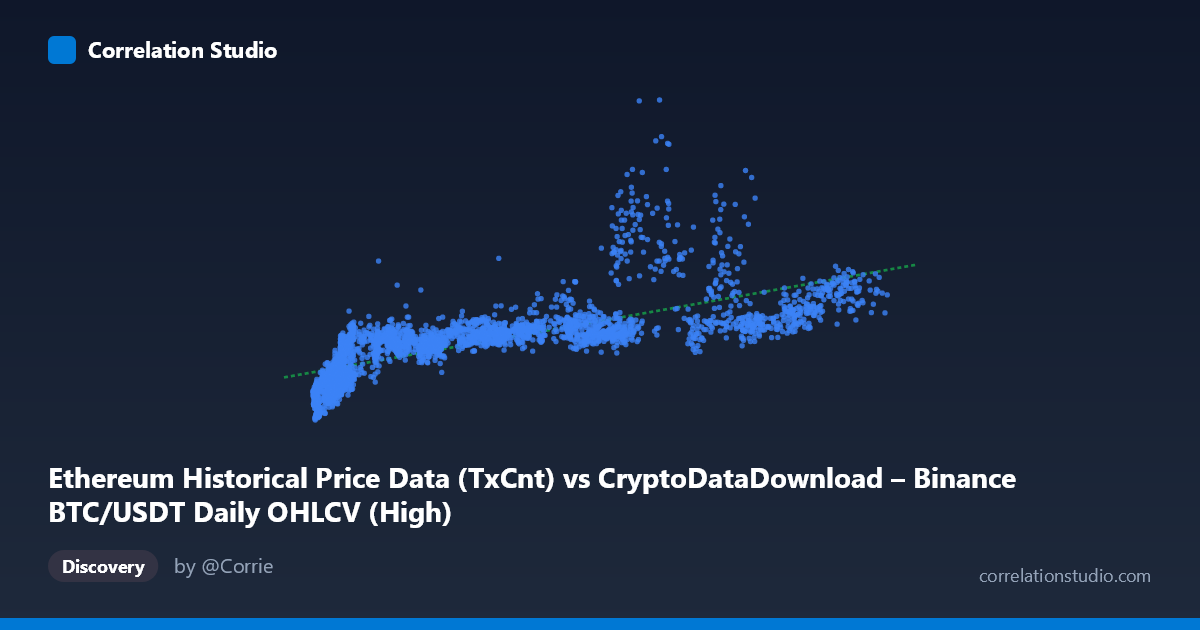
Ethereum Historical Price Data (TxCnt) vs CryptoDataDownload – Binance BTC/USDT Daily OHLCV (High)
- Pearson correlation (r)
- 0.7309
- Spearman correlation
- 0.8824
- p-value
- 0
- Sample size (n)
- 3191
- 95% confidence interval
- 0.7143 to 0.7467
- Granger causality
- None
- Granger optimal lag
- 10
AI analysis
Analysis: Ethereum Transaction Count vs. BTC/USDT Daily High
1. What the Visualization Reveals
The scatterplot shows a moderate-to-strong positive relationship between Ethereum's daily transaction count (X) and Bitcoin's daily high price on Binance (Y). As transaction counts rise from the low thousands into six figures, BTC's high price climbs from roughly $260K to over $3.6M (note: these values suggest either a different price scale, inflation-adjusted index, or possibly BTC priced against a basket rather than raw USDT — the magnitude is unusual for BTC/USDT and worth double-checking in the source data). The general shape is an upward-sloping cloud with considerable vertical scatter, indicating that X is a meaningful but incomplete predictor of Y.
2. Strength, Direction, and Uncertainty
The correlation coefficient (r = 0.731) indicates a moderately strong positive linear relationship, with r² = 0.534 meaning only about 53% of the variance in BTC's high price is statistically explained by Ethereum's transaction count — leaving nearly half the variance driven by other factors. The 95% CI [0.714, 0.747] is tight, and the p-value is effectively 0, so we can be highly confident this correlation is real and not a sampling artifact — but statistical significance here reflects the large sample size (n=3,191) more than it does practical predictive strength. Critically, the Granger causality tests show no significant predictive direction in either direction (X→Y p=0.443; Y→X p=0.665), meaning that despite the contemporaneous correlation, neither series reliably helps forecast future values of the other. This strongly suggests the relationship is driven by a shared external factor (most plausibly overall crypto market growth/adoption cycles) rather than one variable causing or leading the other.
3. Notable Patterns and Outliers
The data shows a fan-shaped or heteroscedastic pattern: scatter around the regression line widens as X increases, meaning predictions become less reliable at higher transaction counts. Several points break the general trend — e.g., (78914, 2,896,417) and (68653, 2,427,417) show high Y values with only moderate X, while other similarly-sized X values (e.g., ~84,000) correspond to Y values under 1.3M. This suggests time-based regime shifts (e.g., bull market peaks where price decouples from network activity) rather than a stable functional relationship. The note that Spearman ρ exceeds Pearson r reinforces that the true relationship is likely non-linear (possibly logarithmic or power-law) rather than a straight line — consistent with typical crypto market dynamics where price can spike disproportionately relative to on-chain fundamentals.
4. Confounding Factors and Caveats
Both series are likely non-stationary time series (trending upward over 2017–2026), which commonly inflates correlation between any two growing crypto-market metrics regardless of causal relationship — a classic spurious correlation risk. Shared macro drivers (overall market sentiment, adoption growth, halving cycles, regulatory news, or simply the mutual bull/bear market cycles of ETH and BTC) plausibly drive both series simultaneously. Additionally, mixing an Ethereum on-chain activity metric with a Bitcoin exchange price metric is unusual — their comovement may reflect general "crypto market beta" rather than any direct economic linkage.
5. Suggestions for Further Investigation
Given the lack of Granger causality, this correlation should not be used for predictive trading signals in its current form. Recommended next steps: (1) test correlation on differenced/returns data rather than levels to remove trend-driven spurious correlation; (2) fit a log-log or polynomial model given the Spearman/Pearson divergence; (3) segment the data by market regime (bull vs. bear phases) to check for structural breaks; and (4) verify the Y-axis units/scale, since BTC "High" values exceeding $3.6M are atypical and may indicate a data or labeling issue worth resolving before drawing further conclusions.
X dataset: CryptoDataDownload – Binance BTC/USDT Daily OHLCV
Y dataset: Ethereum Historical Price Data
Part of experiment: Bitcoin - CryptoDataDownload – Binance BTC/USDT Daily OHLCV vs Ethereum Historical Price Data