Cboe U.S. Equities Historical Market Volume Data 2021 (Tape C Shares) vs Brent Crude Oil Prices: Daily (DCOILBRENTEU) – FRED St. Louis Fed (DCOILBRENTEU)
- Pearson correlation (r)
- -0.4793
- Spearman correlation
- -0.3564
- p-value
- 0
- Sample size (n)
- 247
- 95% confidence interval
- -0.57 to -0.377
- Granger causality
- None
- Granger optimal lag
- 10
AI analysis
Analysis: Brent Crude Oil Price vs. U.S. Equity Market Volume (2021)
Relationship Overview
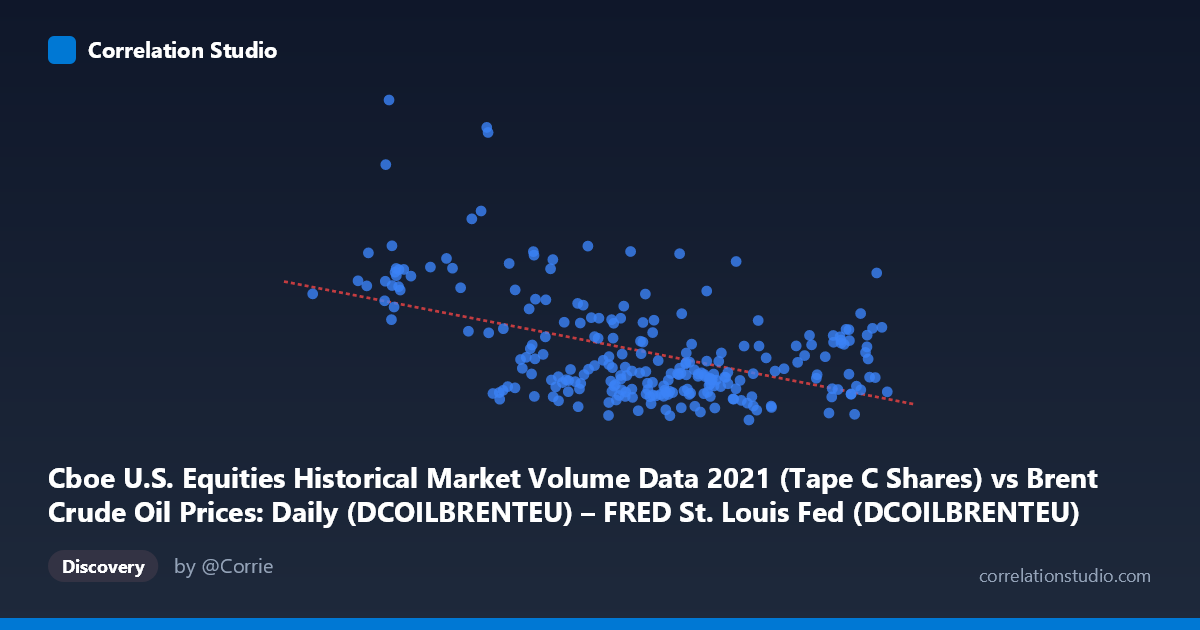
The scatterplot reveals a moderate negative relationship between daily Brent Crude Oil prices (X-axis, in USD/barrel) and U.S. equity market trading volume (Y-axis, Tape C shares). As oil prices rise, equity trading volume tends to decline, and conversely, lower oil prices are associated with elevated trading activity. The linear regression equation (y = −4,279,740x + 574,011,000) quantifies this: each $1/barrel increase in Brent Crude is associated with approximately 4.28 million fewer shares traded. Visually, the cloud of points slopes downward from left to right, though with considerable scatter, suggesting that while the directional tendency is consistent, it is far from a deterministic relationship.
Correlation Strength and Statistical Significance
The Pearson correlation of r = −0.4793 indicates a moderate negative association, but the more informative metric is r² = 0.2297, meaning that Brent Crude price explains only about 23% of the variance in equity trading volume. The remaining ~77% of variability is driven by factors entirely outside this model. The 95% confidence interval for r [−0.5700, −0.3770] is reasonably tight and does not cross zero, and the p-value of 1.33 × 10⁻¹⁵ confirms the relationship is highly statistically significant — effectively ruling out chance given n = 247 paired observations. However, statistical significance here is partly a function of the large underlying population (N = 4,788) and should not be conflated with practical or economic significance. Crucially, Granger causality tests in both directions fail to reach significance (X→Y: F = 0.976, p = 0.465; Y→X: F = 0.786, p = 0.642), meaning neither variable reliably predicts the other temporally at the optimal 10-period lag. The correlation reflects contemporaneous co-movement, not a predictive or causal mechanism.
Notable Patterns, Clusters, and Outliers
Several features stand out in the data. There is a distinct cluster of high-volume, low-price observations in the X = 50–62 range with Y values frequently exceeding 350–450 million shares (e.g., 450.8M at X ≈ 60.2, 414.3M at X ≈ 55.3, 385.5M at X ≈ 57.6), which strongly anchors the negative slope. In contrast, the bulk of observations cluster between X = 65–80 and Y = 180–320 million shares, forming a dense core with moderate scatter. A few high-price outliers exist above X = 82 (up to 85.76), where volume is generally lower but exhibits some spread (e.g., 377.5M at X ≈ 85.1 stands out as anomalous for that price range). The distribution also suggests possible heteroscedasticity — variance in volume appears larger at lower oil prices — which could violate linear regression assumptions and warrants formal testing.
Confounding Factors and Interpretive Caveats
The apparent negative correlation likely reflects shared temporal dynamics rather than a direct economic mechanism. Both series are daily financial time series from 2021, a year shaped by COVID-19 recovery, Federal Reserve policy signals, and commodity supercycle narratives. Low oil prices in early 2021 coincided with elevated retail trading activity (the meme stock era, heightened retail participation), while rising oil prices mid-to-late 2021 aligned with a normalization of market volumes. This means a common time trend — rather than any oil-volume causal link — may be generating the observed correlation. Additionally, Tape C captures only a subset of U.S. equity volume, and using a global crude benchmark (Brent) as a proxy for domestic equity market drivers introduces significant measurement mismatch. Seasonal patterns, macroeconomic policy dates, and volatility regimes (VIX) are all uncontrolled confounders.
Actionable Insights and Further Investigation
Given the absence of Granger causality, practitioners should not use oil prices as a leading indicator for equity volume in any trading or risk model without substantially more evidence. Several next steps would sharpen the analysis: (1) partial correlation analysis controlling for calendar effects, VIX, and S&P 500 returns to isolate whether any residual oil-volume relationship survives; (2) regime-segmented analysis splitting the year into distinct macro periods (e.g., pre/post Fed taper signals) to test whether the relationship is consistent or an artifact of one subperiod; (3) non-linear modeling (e.g., quantile regression or GAMs) given the apparent heteroscedasticity and potential threshold effects at extreme price levels; and (4) extending the time coverage beyond 2021 to assess whether this correlation is structurally stable or specific to the unusual market dynamics of that year. The current findings are statistically robust but economically inconclusive.
X dataset: Brent Crude Oil Prices: Daily (DCOILBRENTEU) – FRED St. Louis Fed
Y dataset: Cboe U.S. Equities Historical Market Volume Data 2021
Part of experiment: Daily - Brent Crude Oil Prices: Daily (DCOILBRENTEU) – FRED St. Louis Fed vs Cboe U.S. Equities Historical Market Volume Data 2021