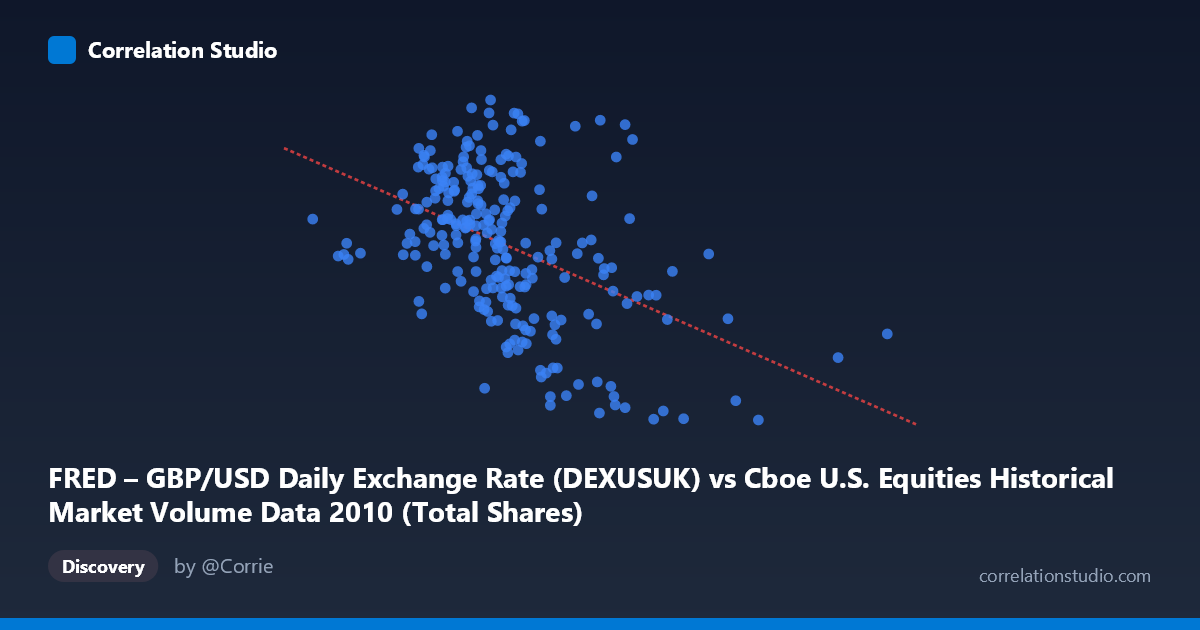
FRED – GBP/USD Daily Exchange Rate (DEXUSUK) vs Cboe U.S. Equities Historical Market Volume Data 2010 (Total Shares)
- Pearson correlation (r)
- -0.4544
- Spearman correlation
- -0.4548
- p-value
- 0
- Sample size (n)
- 249
- 95% confidence interval
- -0.5478 to -0.3498
- Granger causality
- None
- Granger optimal lag
- 1
- Time coverage
- 2010-01-04 to 2010-12-30
- Recomputed on refreshed data
- 2026-10-20 (r was -0.4544)
AI analysis
Scatterplot Analysis: GBP/USD Exchange Rate vs. U.S. Equities Market Volume (2010)
Relationship Overview
The scatterplot reveals a negative relationship between U.S. equities market trading volume (X-axis, measured in shares) and the GBP/USD exchange rate (Y-axis), across 249 paired daily observations spanning the full 2010 calendar year. As daily equity market volume increases, the British pound tends to weaken relative to the U.S. dollar. The linear regression equation (y = -1.128×10⁻¹⁰x + 1.6198) captures this downward slope, though the scatter around the regression line is visually substantial, suggesting the relationship is real but far from deterministic. The data points cluster primarily in the volume range of roughly 450–950 million shares, with the exchange rate oscillating between approximately 1.43 and 1.64 USD/GBP throughout the year.
Correlation Strength and Statistical Significance
The Pearson correlation of r = -0.4544 indicates a moderate negative association. However, the more telling metric is r² = 0.2065, meaning that variation in U.S. equity market volume statistically explains only about 20.6% of the variance in the GBP/USD exchange rate — leaving nearly 80% of exchange rate movement unexplained by this variable alone. The 95% confidence interval for r spans [-0.5478, -0.3498], a range that is meaningfully wide but sits entirely in negative territory, reinforcing directional confidence. The p-value of 4.33×10⁻¹⁴ is extraordinarily small relative to any conventional significance threshold, confirming this is not a chance finding given the sample size of 249 (drawn from a population of N = 3,302 trading days). That said, statistical significance here is partly a function of sample size and should not be conflated with practical or economic significance. The Granger causality results are particularly important: neither direction (X→Y or Y→X) achieves significance at the 5% level (X→Y: F = 0.5608, p = 0.4546; Y→X: F = 3.3877, p = 0.0669). This means neither variable reliably predicts the other temporally — the correlation, while statistically present in cross-section, does not translate into a forecasting relationship at a one-day lag. The Y→X direction (exchange rate predicting volume) approaches but does not cross the significance threshold, representing a weak suggestive signal at best.
Notable Patterns, Clusters, and Outliers
Several features stand out in the data. The bulk of observations form a diffuse central cluster between approximately 500–800 million shares and 1.50–1.62 GBP/USD, with no tight linear structure. There are notable outliers at high volume levels — points exceeding 900 million or approaching 1.1–1.6 billion shares — which consistently appear at lower exchange rate values (1.43–1.56 range), pulling the regression line downward and contributing disproportionately to the observed negative correlation. Specifically, a few extreme-volume days (e.g., ~1.16 billion shares at 1.54, ~1.03 billion at 1.51, ~1.10 billion at 1.44) represent what appear to be episodic high-volume events — likely tied to index rebalancing, market stress, or quarter-end activity — rather than routine trading days. At lower volume levels (below 500 million shares), exchange rates appear more scattered and slightly elevated, consistent with the negative trend. There is also a subtle fan-shaped dispersion, with exchange rate variance appearing somewhat wider in the moderate-volume range, hinting at possible heteroscedasticity.
Confounding Factors and Interpretive Caveats
The observed correlation is almost certainly spurious or mediated by shared macroeconomic drivers rather than reflecting a direct causal link between U.S. equity volume and sterling's value. In 2010, both variables were likely responding to common forces: the European sovereign debt crisis (which weakened GBP and EUR while potentially driving risk-off flight and elevated U.S. equity volatility and volume), U.S. Federal Reserve monetary policy signals, and global risk sentiment shifts. High-volume equity market days often coincide with heightened uncertainty or volatility (e.g., VIX spikes), which simultaneously tend to strengthen the U.S. dollar as a safe-haven currency — this alone could mechanically produce the observed negative correlation without any direct link between the two variables. Furthermore, the dataset covers only a single calendar year (2010), which limits generalizability and makes it difficult to distinguish cyclical patterns from structural relationships. The sampling of every 4th data point, while providing 249 observations, may also introduce subtle autocorrelation artifacts if the underlying daily series are serially correlated.
Actionable Insights and Further Investigation
Given the moderate but unexplained variance and the absence of Granger causality, this correlation should not be used as a standalone trading or forecasting signal. However, several avenues are worth pursuing. First, introducing VIX or realized volatility as a control variable would test whether the correlation disappears once market stress is accounted for — a key step in ruling out the shared-driver hypothesis. Second, extending the analysis across multiple years (2008–2020) would reveal whether the negative correlation is stable, cyclical, or an artifact of 2010's specific macro environment. Third, the borderline Granger result (Y→X, p = 0.067) suggesting the exchange rate may have marginal predictive power over volume deserves follow-up with longer lag structures (2–5 days) and out-of-sample testing. Finally, segmenting the data by regime — pre- and post-major macro events in 2010 such as the May Flash Crash or European bailout announcements — could reveal whether the correlation is driven by specific episodes rather than a persistent structural relationship, which would be critical context for any practical application.
X dataset: Cboe U.S. Equities Historical Market Volume Data 2010
Y dataset: FRED – GBP/USD Daily Exchange Rate
Part of experiment: Daily - Cboe U.S. Equities Historical Market Volume Data 2010 vs FRED – GBP/USD Daily Exchange Rate