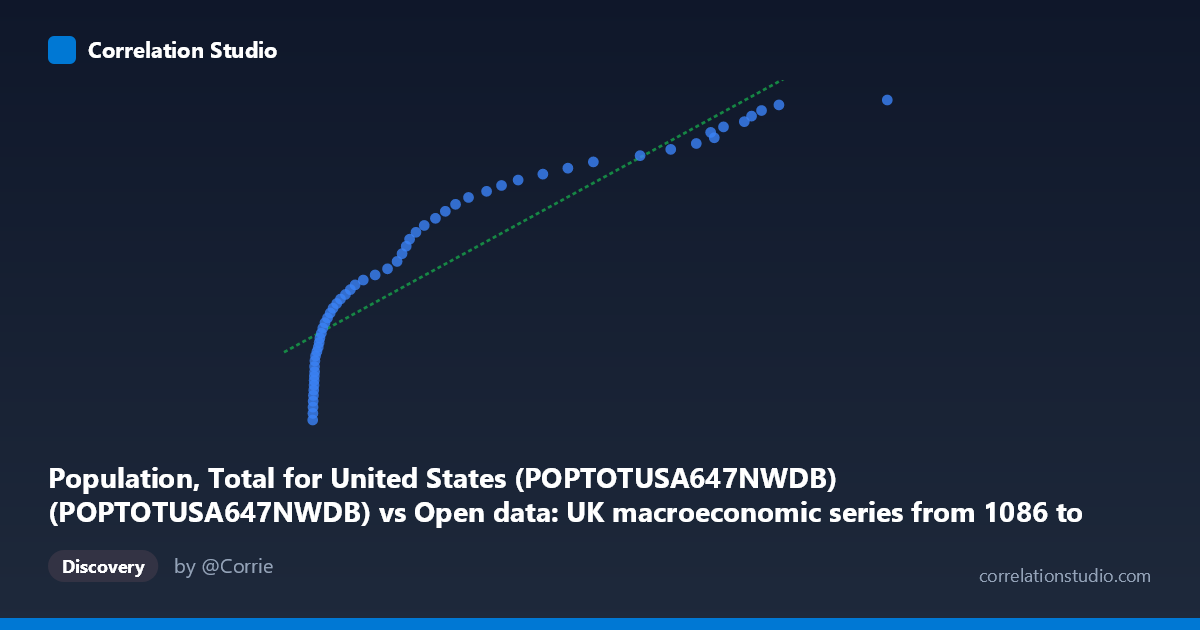
Population, Total for United States (POPTOTUSA647NWDB) (POPTOTUSA647NWDB) vs Open data: UK macroeconomic series from 1086 to present. Bank of England Millennium of Macroeconomic Data. (Month) (value)
- Pearson correlation (r)
- 0.9157
- Spearman correlation
- 0.9999
- p-value
- 0
- Sample size (n)
- 58
- 95% confidence interval
- 0.8611 to 0.9495
- Granger causality
- None
- Granger optimal lag
- 10
AI analysis
Analysis: US Population vs. UK Macroeconomic Data
Relationship Overview
The scatterplot reveals a strong positive relationship between total US population and a UK macroeconomic variable (likely UK population or a closely trending aggregate series from the Bank of England dataset), spanning the period 1960–2017. As US population increases from approximately 481,000 to 116,836,000 (in thousands), the UK variable rises correspondingly from roughly 180.7 million to 326.6 million. The linear regression equation y = 1,231.73x + 218,154,000 describes a moderately steep upward trajectory, and visually the data points appear to trace a relatively coherent curve with modest scatter around the fitted line.
Correlation Strength and Statistical Interpretation
The Pearson correlation of r = 0.9157 indicates a very strong positive association, and the R² of 0.8386 means that approximately 83.9% of the variance in the UK series is statistically "explained" by variation in US population. The 95% confidence interval of [0.8611, 0.9495] is notably narrow, suggesting this estimate is precise and stable across reasonable sampling variation. The p-value of essentially zero confirms the result is highly statistically significant in the classical sense. However, the Granger causality tests tell a critically different story: neither direction (X→Y nor Y→X) reaches significance (F = 0.62, p = 0.79; F = 0.58, p = 0.82 respectively), meaning that knowledge of US population does not improve predictions of the UK variable beyond its own history, and vice versa. This is a vital caveat — high correlation does not imply temporal predictive power here.
Notable Patterns and Features
The data cluster into a broadly continuous sweep rather than discrete groups, consistent with annual time-series data marching steadily upward over six decades. Points at the lower end (US population ~481–2,000 thousand, UK values ~180–220 million) are somewhat more densely packed and show slight curvature, hinting that a logarithmic or power-law fit might capture the relationship marginally better than the linear model. At the upper range, points like (116,836; 326,608,609) and (94,899; 324,353,340) appear consistent with the trend rather than being true outliers. No dramatic breakpoints or structural shifts are visually apparent, though the subtle flattening at higher X values warrants attention.
Confounding Factors and Interpretive Caveats
This correlation is a near-textbook example of spurious correlation driven by shared temporal trend. Both series grow monotonically over time — US population expands steadily post-1960, and most UK macroeconomic aggregates (GDP, total population, money supply) follow long-run upward trends over the same period. Any two such trending series will correlate strongly without any meaningful causal or mechanistic link. The Granger causality results confirm this suspicion explicitly. Additionally, the axis labels appear partially swapped in the dataset metadata, introducing ambiguity about which series is truly on which axis. The sample of 58 from a population frame of 65 is reasonable but the annual frequency limits the power of lag-10 Granger tests.
Actionable Insights and Further Investigation
Analysts should detrend both series (e.g., using first differences, percentage changes, or HP filtering) before drawing any substantive conclusions — the raw-level correlation almost certainly collapses substantially once shared trend is removed. It would be valuable to identify which specific UK macroeconomic variable this represents, as the Bank of England dataset contains hundreds of series with very different economic interpretations. Running cointegration tests (Engle-Granger or Johansen) would determine whether a long-run equilibrium relationship genuinely exists or whether this is pure spurious regression. Finally, if a policy or research question motivates this comparison, structural models incorporating known cross-Atlantic economic linkages (trade flows, financial contagion, demographic spillovers) would provide far more defensible inference than bivariate correlation alone.
X dataset: Open data: UK macroeconomic series from 1086 to present. Bank of England Millennium of Macroeconomic Data. (Month)
Y dataset: Population, Total for United States (POPTOTUSA647NWDB)
Part of experiment: Yearly - Open data: UK macroeconomic series from 1086 to present. Bank of England Millennium of Macroeconomic Data. (Month) vs Population, Total for United States (POPTOTUSA647NWDB)