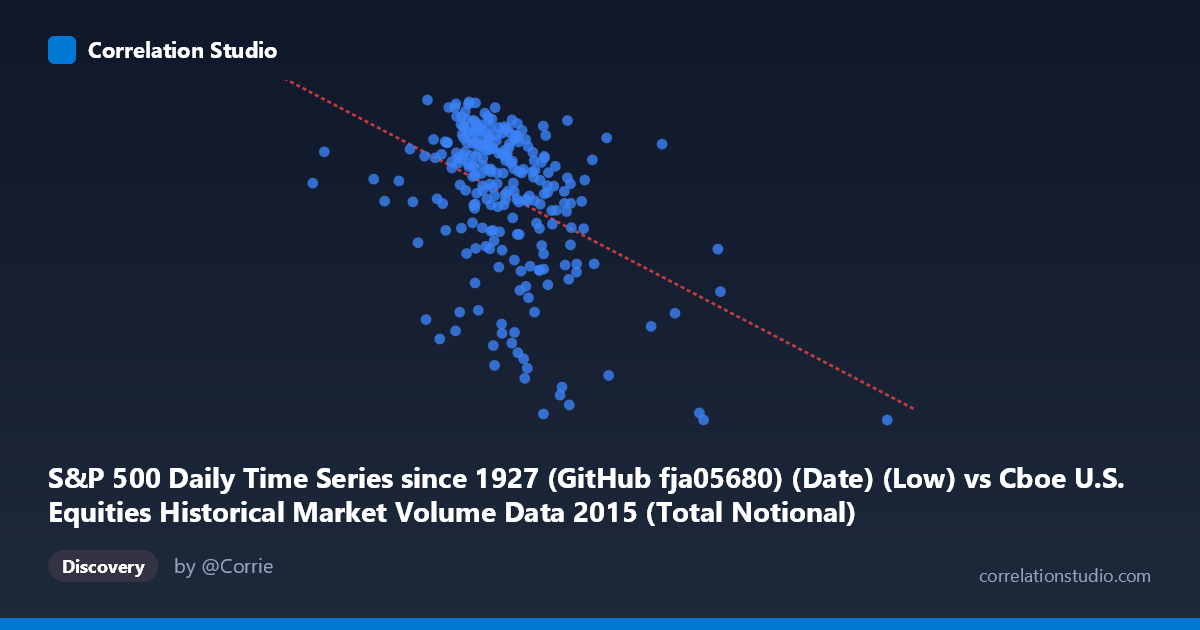
S&P 500 Daily Time Series since 1927 (GitHub fja05680) (Date) (Low) vs Cboe U.S. Equities Historical Market Volume Data 2015 (Total Notional)
- Pearson correlation (r)
- -0.4293
- Spearman correlation
- -0.3893
- p-value
- 0
- Sample size (n)
- 252
- 95% confidence interval
- -0.525 to -0.3228
- Granger causality
- None
- Granger optimal lag
- 2
AI analysis
Scatterplot Analysis: S&P 500 Daily Low vs. Cboe Total Notional Volume (2015)
Relationship Overview The scatterplot reveals a negative relationship between the S&P 500 daily low price and Cboe U.S. equities total notional volume for 2015. As the S&P 500 low increases (higher price levels), total notional trading volume tends to decrease, and conversely, lower price readings are associated with elevated notional volume. This pattern is consistent with the well-established market behavior where volatility spikes and price declines drive surges in trading activity, while calmer, higher-price environments see relatively subdued volume. The linear regression equation (y = -5.857×10⁻⁹x + 2173.74) confirms this inverse slope, though the relationship is clearly noisy and far from deterministic.
Correlation Strength and Statistical Significance The Pearson correlation of r = -0.4293 indicates a moderate negative association. While statistically robust — the p-value of 1.011×10⁻¹² is extraordinarily small, and the 95% confidence interval of [-0.525, -0.323] excludes zero entirely — the practical explanatory power is modest. The R² = 0.1843 tells the more sobering story: S&P 500 daily low price explains only about 18.4% of the variance in total notional volume, leaving roughly 81.6% attributable to other factors. With N = 3,302 and n = 252 paired observations, the sample is adequately powered to detect this effect, but the wide confidence interval reminds us that the true correlation could range from weakly to moderately negative. Critically, the Granger causality tests are non-significant in both directions (X→Y: F = 2.25, p = 0.108; Y→X: F = 0.156, p = 0.855), meaning neither variable reliably predicts the other temporally with a 2-period lag. This rules out a simple lead-lag predictive relationship and suggests the correlation may reflect contemporaneous co-movement driven by shared external forces rather than direct causation.
Notable Patterns, Clusters, and Outliers Several features stand out visually. The bulk of observations cluster in a band where S&P 500 lows range approximately from 17 billion to 25 billion (in the scaled X units) and notional volume between roughly 2,000 and 2,125, forming a moderately dense core. However, there is a distinct right-tail cluster of outliers with X values extending to ~37–49 billion, consistently paired with lower notional volumes in the 1,867–1,987 range — these likely correspond to the August–September 2015 market correction, when the S&P 500 fell sharply and volume surged dramatically. A few points near the lower-left (e.g., x ≈ 7.2B, y ≈ 2,059) also appear isolated. The scatter is heteroscedastic — variance in Y appears wider at intermediate X values and compressed at extremes — suggesting the linear model may not fully capture the underlying dynamics.
Confounding Factors and Caveats Several important caveats apply. Notional volume is itself a product of price × share volume, meaning the S&P 500 price level mechanically influences notional calculations — the negative correlation may partly reflect this arithmetic relationship rather than purely behavioral trading dynamics. Additionally, both variables are driven by market regime: the August 2015 volatility event simultaneously pushed prices down and notional volume up, making it a confounding episode that inflates the correlation. Seasonal patterns in trading activity (e.g., summer doldrums, year-end effects), index composition changes, and macro events (Federal Reserve rate decisions, global growth concerns) all independently affect both variables. The Granger non-result also warns against interpreting temporal sequences causally.
Actionable Insights and Further Investigation Practitioners should avoid over-interpreting this correlation as a trading signal given the weak R² and absent Granger causality. However, the relationship does reinforce the risk-on/risk-off volume asymmetry useful in volatility modeling. Suggested next steps include: (1) segmenting the data by market regime (calm vs. stressed periods, particularly isolating August–September 2015) to test whether the correlation strengthens materially during drawdowns; (2) replacing price level with daily return or intraday range as the X variable to better isolate volatility effects from price-level mechanics; (3) incorporating VIX or implied volatility data as a potential mediating variable via path analysis; and (4) testing non-linear models (e.g., piecewise regression or quantile regression) given the apparent threshold behavior at extreme volume levels.
X dataset: Cboe U.S. Equities Historical Market Volume Data 2015
Y dataset: S&P 500 Daily Time Series since 1927 (GitHub fja05680) (Date)
Part of experiment: Daily - Cboe U.S. Equities Historical Market Volume Data 2015 vs S&P 500 Daily Time Series since 1927 (GitHub fja05680) (Date)