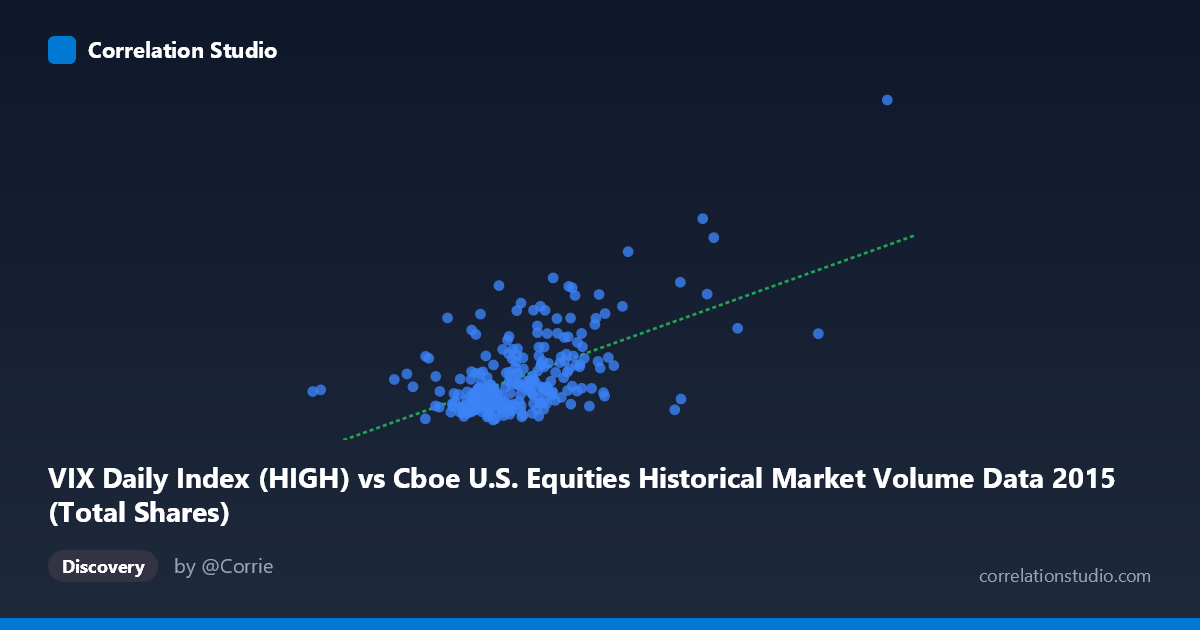
VIX Daily Index (HIGH) vs Cboe U.S. Equities Historical Market Volume Data 2015 (Total Shares)
- Pearson correlation (r)
- 0.5785
- Spearman correlation
- 0.4739
- p-value
- 0
- Sample size (n)
- 252
- 95% confidence interval
- 0.4899 to 0.6552
- Granger causality
- None
- Granger optimal lag
- 1
AI analysis
Scatterplot Analysis: VIX High vs. Total Shares Volume (2015)
Relationship Overview The scatterplot reveals a moderate positive relationship between the CBOE VIX Daily Index (High) and total U.S. equity shares traded, captured across 252 trading days in 2015. As VIX High values increase — reflecting elevated market fear or uncertainty — total share volume tends to rise correspondingly. This is consistent with well-established market microstructure intuition: heightened volatility drives increased trading activity as investors rebalance, hedge, or react to market stress. The linear regression equation (y = 2.986×10⁻⁸x + 2.032) confirms a positive slope, though the relatively large intercept and wide scatter suggest that volume is driven by many factors beyond volatility alone.
Correlation Strength and Statistical Significance The Pearson correlation of r = 0.5785 indicates a moderate positive association, and with r² = 0.3346, approximately 33.5% of the variance in total shares traded is explained by VIX High values. While statistically meaningful, this leaves roughly two-thirds of volume variance unexplained by volatility alone. The 95% confidence interval of [0.4899, 0.6552] is relatively tight given n = 252, and the p-value of effectively zero confirms this correlation is highly unlikely to be a product of chance. However, despite the solid contemporaneous correlation, the Granger causality tests yield no significant predictive directionality — neither X→Y (F = 0.062, p = 0.804) nor Y→X (F = 0.071, p = 0.790) achieves significance at a 1-period lag. This means that while VIX High and volume move together, past values of one do not reliably predict future values of the other, limiting tactical forecasting utility.
Notable Patterns, Clusters, and Outliers The data exhibits a dense central cluster roughly between VIX High values of 12–20 and volume near 13–20 billion shares, reflecting the relatively calm majority of 2015 trading. Above a VIX High threshold of approximately 25, the relationship becomes notably more dispersed, with a handful of high-leverage outlier observations — most visibly, points approaching VIX Highs of 40–53 paired with exceptional volume readings above 28–38 billion shares. These extreme points likely correspond to specific stress episodes in 2015 (notably the August 2015 market correction, during which VIX spiked above 50 intraday). The regression line appears to be disproportionately influenced by these upper-tail observations, and the relationship may be stronger in the tails than in calm periods.
Confounding Factors and Caveats Several important caveats limit interpretation. First, the axis labels appear transposed in the dataset metadata — VIX values logically belong on the Y-axis as the volatility measure, while volume belongs on X, or vice versa; this warrants verification. Second, confounding seasonal and macroeconomic factors in 2015 — including Federal Reserve rate decisions, China market turbulence, and energy sector stress — simultaneously affected both volatility and volume, making causal attribution unreliable. Third, the failure of Granger causality tests at a 1-period lag only is a limitation; longer lags may reveal delayed predictive dynamics. Finally, because the sample draws from a single calendar year (N = 3,302 underlying observations, n = 252 daily pairs), findings may not generalize across different market regimes.
Actionable Insights and Further Investigation Practitioners should treat VIX levels as a contemporaneous signal of elevated volume rather than a forward-looking predictor at a daily frequency. For further investigation, it would be valuable to: (1) test Granger causality at lags of 2–5 periods to capture any delayed volume response; (2) segment the data by volatility regime (e.g., VIX < 15, 15–25, 25) to assess whether the correlation strengthens nonlinearly during stress periods; (3) incorporate additional predictors such as S&P 500 returns, bid-ask spreads, or options open interest to build a more complete volume model; and (4) replicate the analysis across multiple years to assess whether the 2015 relationship — heavily influenced by the August correction — is structurally stable or episodic.
X dataset: Cboe U.S. Equities Historical Market Volume Data 2015
Y dataset: VIX Daily Index
Part of experiment: Daily - Cboe U.S. Equities Historical Market Volume Data 2015 vs VIX Daily Index