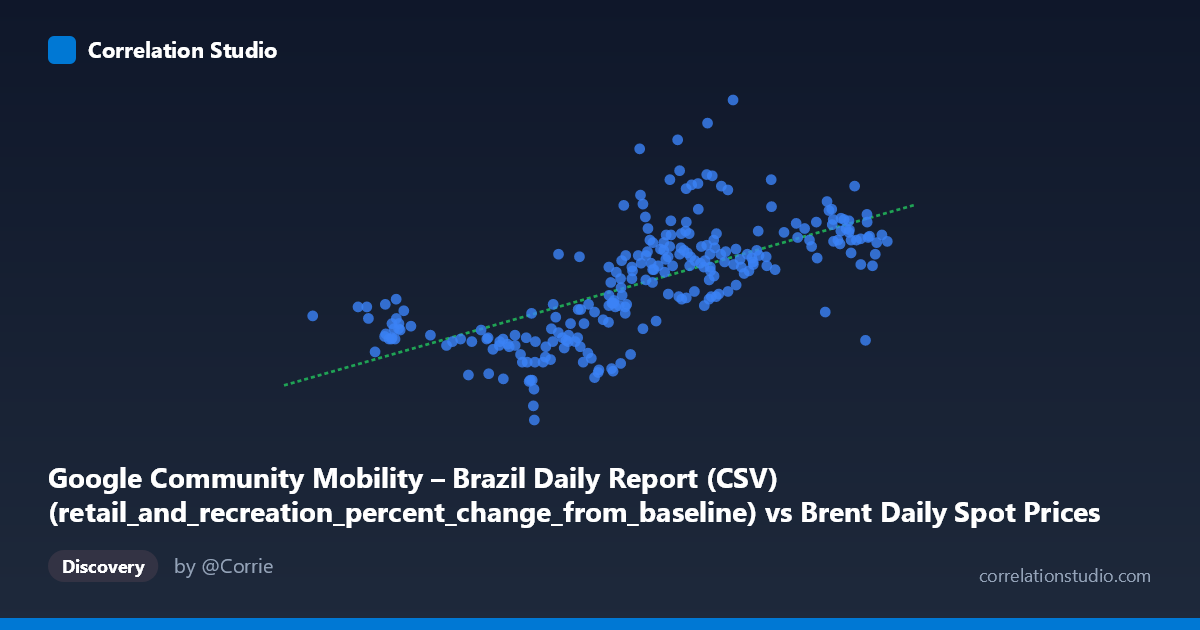
Google Community Mobility – Brazil Daily Report (CSV) (retail_and_recreation_percent_change_from_baseline) vs Brent Daily Spot Prices (Price)
- Pearson correlation (r)
- 0.6664
- Spearman correlation
- 0.7536
- p-value
- 0
- Sample size (n)
- 253
- 95% confidence interval
- 0.5917 to 0.7297
- Granger causality
- None
- Granger optimal lag
- 1
AI analysis
Scatterplot Analysis: Brazil Retail/Recreation Mobility vs. Brent Crude Oil Prices (2021)
Relationship Overview
The scatterplot reveals a moderate positive linear relationship between Google Community Mobility retail/recreation percent changes in Brazil and Brent crude oil daily spot prices across 2021. As Brent prices increase (moving right along the X-axis, ranging from ~50 to ~86 USD/barrel), Brazil's retail and recreation mobility tends to shift upward — from deeply negative values (around -46%) toward near-zero or modestly positive territory. The regression line (y = 1.20x − 95.58) captures this upward trend, suggesting that for every $1/barrel increase in Brent prices, mobility improves by roughly 1.2 percentage points relative to baseline. This likely reflects a shared temporal driver: both variables trending together across the calendar year as pandemic conditions evolved and economic activity recovered.
Correlation Strength and Statistical Interpretation
The Pearson correlation of r = 0.666 indicates a moderate-to-strong positive association, but the explained variance tells a more sobering story — R² = 0.444 means that only 44.4% of the variance in mobility is accounted for by Brent prices, leaving over 55% unexplained by this linear model alone. The 95% confidence interval [0.592, 0.730] is reasonably tight given the sample of n = 253 paired observations drawn from a population of N = 1,095, and the p-value of effectively zero confirms this relationship is statistically highly significant and not a sampling artifact. However, the Granger causality results undercut any causal interpretation entirely: neither direction of temporal predictability is significant (X→Y: F = 1.74, p = 0.189; Y→X: F = 0.015, p = 0.904). This means that knowing today's Brent price does not statistically improve prediction of tomorrow's mobility, and vice versa — the correlation is contemporaneous and almost certainly reflects a common underlying temporal trend rather than any direct causal mechanism.
Notable Patterns, Clusters, and Outliers
Several structural features are visible in the sample data. There is a notable cluster of points in the mid-X range (68–76 USD/barrel) with Y values scattered widely from approximately -20% to +25%, indicating considerable heteroscedasticity — variance in mobility is substantially larger at moderate oil prices than at the extremes. At the lower end of Brent prices (~50–65 USD/barrel), mobility values are predominantly and deeply negative (clustering around -20% to -46%), consistent with early-2021 pandemic restrictions when both oil demand and public mobility were suppressed. One striking outlier is the point near (64, -46), which represents an extreme mobility depression episode. At the upper Brent range (~80–85 USD/barrel), mobility values converge near zero or slightly positive, reflecting late-2021 reopening. The spread does not tighten dramatically at high X values, suggesting the relationship is not purely deterministic even at peak oil prices.
Confounding Factors and Interpretive Caveats
The most significant caveat is that both variables are time series with strong shared temporal trends across 2021: Brent prices rose broadly from ~$50 in January to ~$85 in October-November, while Brazilian mobility also generally recovered as vaccination progressed and COVID-19 restrictions eased. This creates spurious or inflated correlation through parallel secular trends — a classic confounding structure in time-series cross-correlation. The datasets originate from fundamentally different domains (global energy commodity markets vs. local Brazilian behavioral data), and there is no plausible direct mechanism linking crude oil spot prices to whether Brazilians visit shopping centers. Seasonal effects, public health policy changes, vaccination rollout timelines, and Brazilian economic conditions are all probable confounders driving both series simultaneously. The mislabeled dataset metadata (each dataset's column appears assigned to the other's axis label) should also be verified before drawing any conclusions.
Actionable Insights and Further Investigation
Given the absence of Granger causality, this correlation should not be used for predictive modeling in either direction. Instead, the appropriate next step is to detrend both time series (e.g., using first-differencing or a rolling baseline subtraction) and retest the correlation — if it collapses toward zero after detrending, this confirms the relationship is entirely an artifact of shared temporal momentum. It would be valuable to introduce explicit control variables such as weekly COVID case counts in Brazil, vaccination coverage rates, and Brazilian GDP proxies to partial out confounders. Researchers should also consider testing mobility against Brazilian-specific energy prices or consumer fuel costs, which would have a more plausible direct link to retail behavior than global Brent spot prices. Finally, segmenting the data by Brazilian state or by pandemic phase (pre/post-vaccination rollout) could reveal whether the apparent correlation strengthens or disappears within more homogeneous subperiods, clarifying whether any genuine relationship exists beyond the shared 2021 recovery trend.
X dataset: Brent Daily Spot Prices
Y dataset: Google Community Mobility – Brazil Daily Report (CSV)
Part of experiment: Daily - Brent Daily Spot Prices vs Google Community Mobility – Brazil Daily Report (CSV)