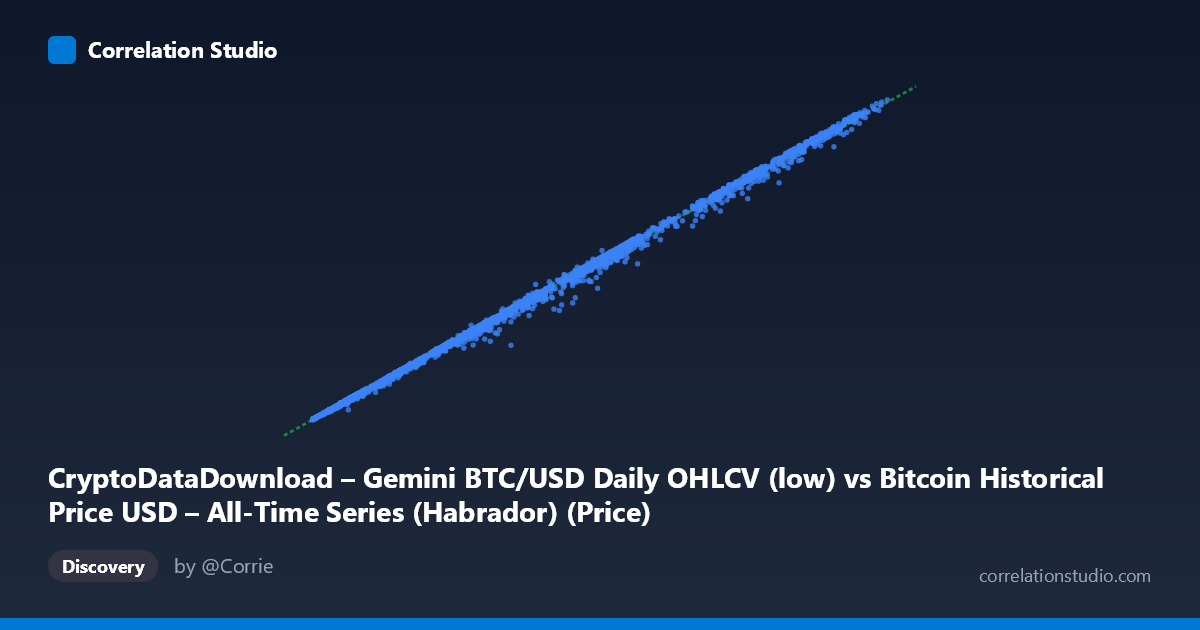
CryptoDataDownload – Gemini BTC/USD Daily OHLCV (low) vs Bitcoin Historical Price USD – All-Time Series (Habrador) (Price)
- Pearson correlation (r)
- 0.9995
- Spearman correlation
- 0.9996
- p-value
- 0
- Sample size (n)
- 3856
- 95% confidence interval
- 0.9995 to 0.9995
- Granger causality
- None
- Granger optimal lag
- 10
- Time coverage
- 2015-10-08 to 2026-04-28
- Recomputed on refreshed data
- 2026-10-23 (r was 0.9995)
AI analysis
Analysis: Bitcoin Daily Low Price — Cross-Source Comparison
1. What the Visualization Reveals
This scatterplot compares two ostensibly independent records of the same underlying phenomenon: Bitcoin's daily low price, sourced once from CryptoDataDownload's Gemini feed and once from a separate Habrador historical dataset. The plot shows an almost perfectly linear relationship along the y = x diagonal, with points ranging from sub-$500 (early Bitcoin history) to over $120,000 (recent all-time highs). The near-total absence of scatter around the regression line—even at very different price magnitudes—indicates these are not merely correlated variables but two measurements of the identical underlying asset price.
2. Strength, Direction, and Practical Meaning
The correlation coefficient (r = 0.9995, r² = 0.999) indicates that 99.9% of the variance in one series is explained by the other—an essentially deterministic relationship rather than a statistical association. The 95% confidence interval is vanishingly narrow [0.9995, 0.9995], and the p-value is effectively zero, meaning there is no meaningful uncertainty about the existence of this relationship at this sample size (n=3,856). The regression slope of 0.98 with a small negative intercept (-119.22) suggests the two sources track almost identically, with only a slight systematic scaling difference (Gemini lows running ~2% below the Habrador series, likely due to exchange-specific liquidity/spread differences). Critically, the Granger causality tests show no significant predictive direction in either direction (p ≈ 0.29–0.30)—this is expected and correct, since neither series "causes" the other; they are contemporaneous records of the same market event, not independent time series with a lead-lag relationship.
3. Notable Patterns and Features
The data spans multiple market regimes (2015–2026), covering Bitcoin's major bull and bear cycles, yet the linear relationship holds consistently across all price scales—from ~$250 to ~$125,000—with no visible curvature, heteroscedasticity, or regime-dependent breakdown. This is notable because many financial relationships degrade at extremes; here, the tight fit at both the lowest and highest price points suggests robust data quality in both sources. No meaningful outlier clusters are evident in the sampled points, though minor deviations (e.g., 15155.23 vs. 14000.00, or 64151.00 vs. 60360.00) hint at occasional larger discrepancies, possibly during high-volatility days where "daily low" timing/definition varies slightly between exchanges or data vendors.
4. Confounding Factors and Caveats
Because both variables represent the same underlying asset (BTC/USD daily low), this is a data reconciliation exercise, not a discovery of a genuine causal or economic relationship. Apparent "predictive" or "explanatory" framing should be avoided—high r² here reflects redundancy, not insight. Differences between the two series likely stem from: (a) different exchanges (Gemini vs. whatever composite/source underlies Habrador) having different order books and thus different daily lows; (b) timezone or "trading day" boundary differences; (c) data cleaning/interpolation methodology. The Granger non-causality result should not be misread as "no relationship"—it correctly reflects that these are simultaneous measurements, not sequentially causal series.
5. Actionable Insights
This analysis is best used for data quality validation and cross-source reconciliation rather than market prediction. Recommended next steps: (1) isolate and examine the outlier points where deviation exceeds ~5% to identify specific dates/conditions causing divergence (likely flash-crash or thin-liquidity days); (2) determine whether the slight negative bias (slope <1, negative intercept) is systematic enough to warrant a calibration adjustment when merging these sources; (3) if building a unified BTC price series, consider using this regression to harmonize the two feeds, or default to the Gemini series for its more granular OHLCV structure while using Habrador as a validation/backfill source for periods Gemini doesn't cover.
X dataset: Bitcoin Historical Price USD – All-Time Series (Habrador)
Y dataset: CryptoDataDownload – Gemini BTC/USD Daily OHLCV
Part of experiment: Bitcoin - Bitcoin Historical Price USD – All-Time Series (Habrador) vs CryptoDataDownload – Gemini BTC/USD Daily OHLCV