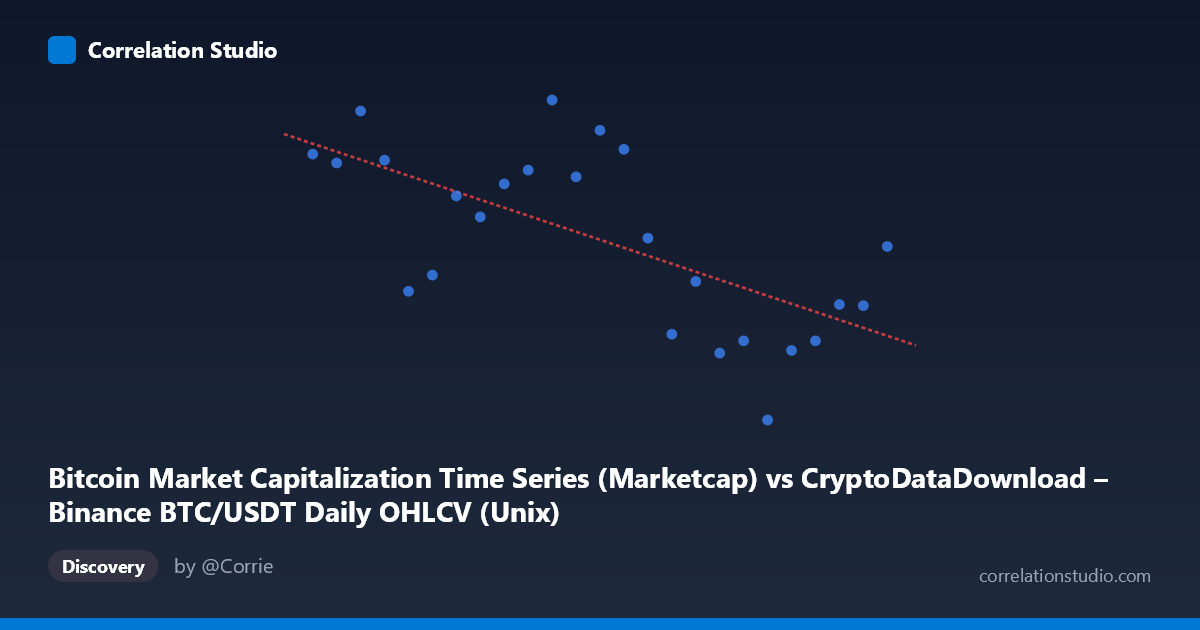
Bitcoin Market Capitalization Time Series (Marketcap) vs CryptoDataDownload – Binance BTC/USDT Daily OHLCV (Unix)
- Pearson correlation (r)
- -0.6599
- Spearman correlation
- -0.6623
- p-value
- 0.000332
- Sample size (n)
- 25
- 95% confidence interval
- -0.8368 to -0.3581
- Granger causality
- None
- Granger optimal lag
- 6
- Time coverage
- 2024-03-29 to 2024-04-22
AI analysis
Analysis: Bitcoin Market Cap vs. Time-Indexed OHLCV Series
1. What the Visualization Reveals
This scatterplot essentially tracks Bitcoin's market capitalization against time (the X-axis is a Unix timestamp spanning late March to late April 2024). Despite being framed as two separate "datasets," the underlying data is effectively BTC market cap plotted against its own timestamp — meaning the "correlation" here is really describing a trend over time: Bitcoin's market cap declined over this ~24-day window. The scatter shows a downward-sloping cloud of points, consistent with a price decline from a local high (~$1.41T on 3/29) toward a trough (~$1.21T on 4/17-4/22).
2. Strength, Direction, and Statistical Confidence
The correlation is moderate-to-strong and negative (r = -0.66), indicating that as time progressed, market cap tended to decrease. However, r² = 0.435 means only 43.5% of the variance in market cap is explained by the linear time trend — the majority of day-to-day fluctuation (56.5%) is unexplained by a simple linear decline, reflecting the inherent volatility of crypto markets. The 95% CI [-0.84, -0.36] is fairly wide, meaning the true relationship could range from mild to quite strong negative — this is typical for n=25 with noisy financial data. The p-value (0.00033) is statistically significant, giving confidence the negative trend is real and not due to chance. Critically, the Granger causality test shows no significant predictive relationship in either direction (p 0.89 both ways) — meaning neither series meaningfully forecasts the other at any tested lag. This reinforces that the "relationship" here is a contemporaneous trend artifact, not a causal or predictive dynamic.
3. Notable Patterns and Outliers
The data shows a non-monotonic, choppy decline rather than a smooth linear drop — early April values cluster high (~$1.35-1.40T around 3/29-4/9), followed by a sharper drop-off after 4/13, bottoming near $1.21-1.26T in the 4/13-4/22 window, with a mild rebound at the very end (4/22: $1.32T). This suggests at least two regimes: a consolidation/topping phase followed by a correction phase — a pattern linear regression alone cannot capture, explaining the substantial unexplained variance (56.5%).
4. Confounding Factors and Caveats
Since X is literally a timestamp, this isn't a relationship between two independent economic variables — it's a time-series trend, and standard Pearson correlation/regression assumes independence and linearity, which is inappropriate for autocorrelated financial data. Market cap is also mechanically driven by price × circulating supply, so this analysis says nothing about causal drivers (macro news, ETF flows, liquidations, etc.) behind the observed decline. The short 24-day window and n=25 sample are also vulnerable to short-term noise, exchange-specific volume anomalies, and lack broader market context (e.g., BTC dominance, macro rates).
5. Suggestions for Further Investigation
Rather than treating this as a correlation between two variables, it should be reframed as trend/change-point analysis: apply time-series methods (ARIMA, changepoint detection) to identify the regime shift around April 13. Extend the window to capture more history and reduce short-term noise sensitivity, and incorporate exogenous variables (funding rates, ETF flow data, macro indicators) to explain the 56% unexplained variance meaningfully.
X dataset: CryptoDataDownload – Binance BTC/USDT Daily OHLCV
Y dataset: Bitcoin Market Capitalization Time Series
Part of experiment: Bitcoin - CryptoDataDownload – Binance BTC/USDT Daily OHLCV vs Bitcoin Market Capitalization Time Series