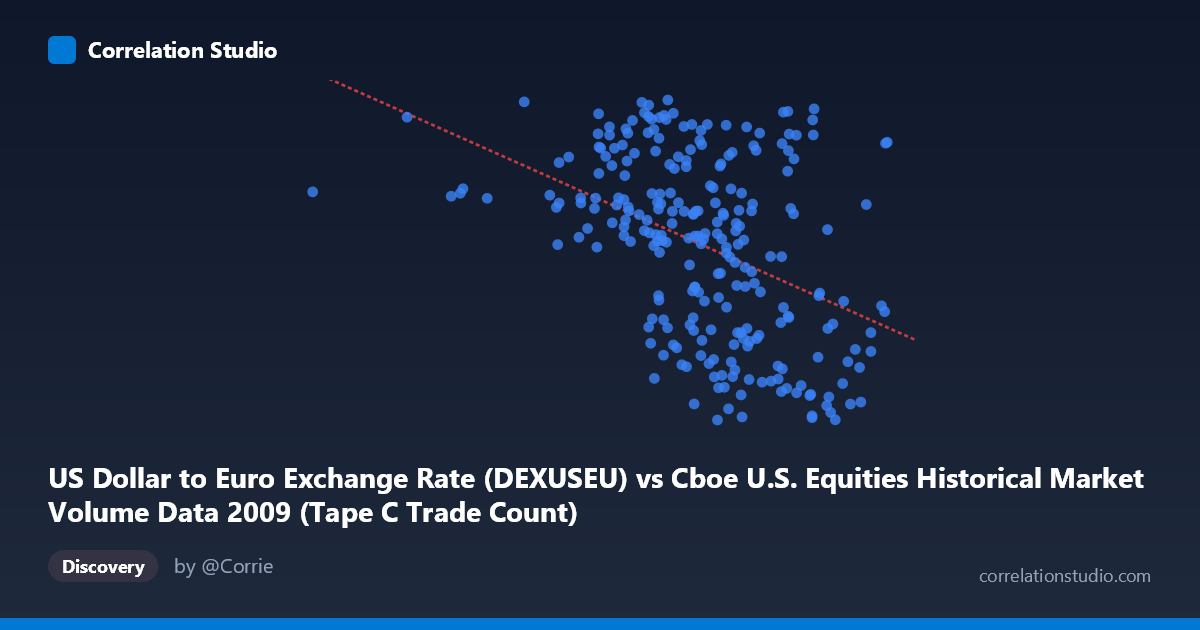
US Dollar to Euro Exchange Rate (DEXUSEU) vs Cboe U.S. Equities Historical Market Volume Data 2009 (Tape C Trade Count)
- Pearson correlation (r)
- -0.4251
- Spearman correlation
- -0.4368
- p-value
- 0
- Sample size (n)
- 250
- 95% confidence interval
- -0.5217 to -0.3178
- Granger causality
- None
- Granger optimal lag
- 1
AI analysis
Analysis: USD/Euro Exchange Rate vs. Cboe Tape C Trade Count (2009)
Relationship Overview The scatterplot reveals a modest negative relationship between the US Dollar to Euro exchange rate and Cboe Tape C trade counts during 2009. As the exchange rate increases (dollar strengthening relative to the euro), trade counts tend to decline, and vice versa. The linear regression equation (y = -3.08×10⁻⁷x + 1.590) captures this downward slope, though the scatter around the regression line is considerable. The data points span a wide X range (~186K to ~849K trades), while the Y range is relatively compressed (1.25–1.51 USD/EUR), suggesting that trade volume variation is substantially greater than exchange rate variation in proportional terms.
Correlation Strength and Statistical Significance The Pearson correlation of r = -0.4251 indicates a moderate negative association, but the explanatory power is limited: r² = 0.1807 means only ~18.1% of variance in the exchange rate is explained by trade count, leaving roughly 82% attributable to other factors. The 95% confidence interval of [-0.522, -0.318] is entirely negative, confirming directional consistency, and the p-value of 2.15×10⁻¹² is highly significant given n=250, making it statistically implausible that this correlation arose by chance. However, Granger causality tests reveal no significant predictive directionality in either direction (X→Y: F=1.24, p=0.27; Y→X: F=1.72, p=0.19), meaning that past values of trade count do not reliably predict future exchange rates, and past exchange rates do not reliably predict future trade counts at a one-period lag. This is a critical caveat: statistical correlation does not translate into temporal predictive utility here.
Notable Patterns and Outliers Several features stand out in the sample points. There is a notable outlier at approximately (185,887; 1.44) — an unusually low trade count paired with a mid-range exchange rate — which likely reflects an early January trading day with anomalously low market activity (possibly a holiday-adjacent session). A loose cluster of high trade counts (700K–849K) tends to pair with lower exchange rates (1.26–1.35), consistent with the negative trend, and potentially corresponding to periods of heightened US equity market stress when the dollar was relatively stronger. Conversely, moderate trade counts (470K–600K) show more dispersed exchange rate values (1.40–1.51), suggesting the relationship weakens at intermediate volume levels. There are no strong signs of non-linearity, but the variance appears to fan slightly — hinting at possible heteroscedasticity across the volume range.
Confounding Factors and Caveats Several confounding factors complicate interpretation. 2009 was an extraordinary year encompassing the tail of the global financial crisis, the March equity market trough, and a subsequent strong recovery — regime shifts that would independently drive both trade volumes and currency movements. Macro risk sentiment (VIX, credit spreads) likely acts as a common driver: risk-off episodes simultaneously reduce equity trading appetite and strengthen the dollar as a safe-haven currency, which would manufacture a negative correlation without any direct causal mechanism between the two variables. Additionally, Tape C specifically captures NYSE Arca-listed securities, so this trade count does not represent total US market volume, potentially introducing selection bias. The axis labels also appear swapped in the dataset metadata (exchange rate labeled as Tape C and vice versa), warranting data verification before drawing firm conclusions.
Actionable Insights and Further Investigation Given the absence of Granger causality, practitioners should not use this relationship for short-term trading signals. However, the correlation's existence warrants deeper investigation into shared macro drivers. Recommended next steps include: (1) incorporating VIX or credit spread data as a control variable to test whether the correlation disappears once risk sentiment is accounted for — which would strongly support the common-driver hypothesis; (2) segmenting the data into pre- and post-March 2009 (crisis vs. recovery) to test whether the correlation is regime-dependent; (3) extending the analysis to other Tape designations (A, B) and total market volume to assess whether the Tape C finding generalizes; and (4) testing longer Granger lags (5, 10, 22 days) since daily one-period lags may be too short to capture meaningful macro feedback loops between currency markets and equity trading activity.
X dataset: Cboe U.S. Equities Historical Market Volume Data 2009
Y dataset: US Dollar to Euro Exchange Rate
Part of experiment: Daily - Cboe U.S. Equities Historical Market Volume Data 2009 vs US Dollar to Euro Exchange Rate