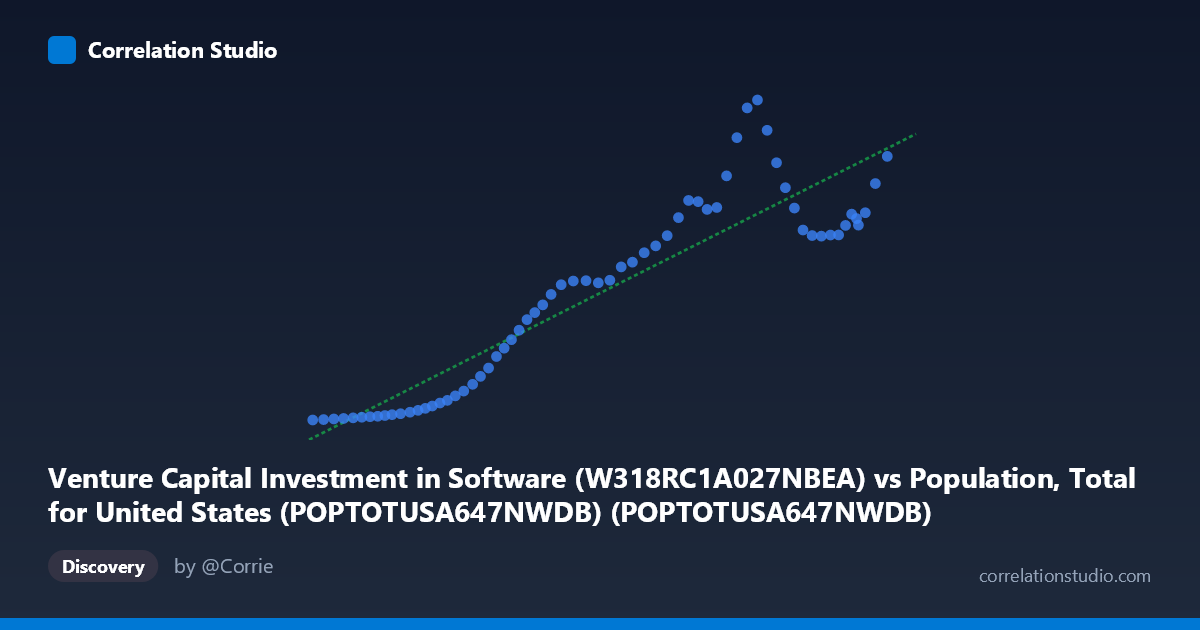
Venture Capital Investment in Software (W318RC1A027NBEA) vs Population, Total for United States (POPTOTUSA647NWDB) (POPTOTUSA647NWDB)
- Pearson correlation (r)
- 0.9159
- Spearman correlation
- 0.9236
- p-value
- 0
- Sample size (n)
- 65
- 95% confidence interval
- 0.8653 to 0.948
- Granger causality
- None
- Granger optimal lag
- 10
AI analysis
Scatterplot Analysis: U.S. Population vs. Venture Capital Investment in Software
Relationship Overview
The scatterplot reveals a strong positive relationship between total U.S. population (X-axis) and venture capital investment in software (Y-axis) spanning 1960 to 2024. As population grows from approximately 180.7 million to 340.1 million, software investment rises dramatically from near-zero levels (around $6) to peaks exceeding $466 billion. The linear regression equation (y = 2.61121E-06x − 491.205) captures the general upward trend, though the distribution of points suggests the relationship may be better characterized as exponential or power-law in nature — particularly at higher population values where investment figures spread more widely and reach extreme highs.
Correlation Strength and Statistical Significance
The Pearson correlation of r = 0.9159 indicates a very strong positive association, and the R² of 0.8389 means that approximately 83.9% of the variance in software investment is statistically explained by population size within this linear model. The 95% confidence interval for r [0.8653, 0.9480] is relatively tight and excludes zero entirely, and the p-value of essentially 0 confirms this result is highly statistically significant across all conventional thresholds. However, the Granger causality results are notably null — neither direction (X→Y: F=1.06, p=0.42; Y→X: F=1.08, p=0.40) achieves significance at an optimal lag of 10 periods. This is a critical caveat: despite the impressive correlation, population does not temporally predict software investment, nor does software investment temporally predict population, meaning the statistical association should not be interpreted as evidence of a causal or even predictively useful directional relationship.
Notable Patterns, Clusters, and Outliers
The data separates into at least two visually distinct behavioral regimes. For population values below roughly 250 million (pre-approximately 1990), software investment values cluster tightly near zero, forming a dense low-investment band. Beyond the 270–280 million population threshold, values begin dispersing dramatically upward, with several notable outliers pulling above the regression line — most prominently the point near (301M, 455), (304M, 466), and (298M, 412). These high-leverage outliers correspond to likely peak venture capital years (e.g., the dot-com boom circa 1999–2000 and the post-2020 tech investment surge). The lower-right cluster of points (population ~310–340M, investment ~270–390) forms a secondary grouping that sits somewhat below the trajectory set by those peak outliers, suggesting investment pullback after speculative peaks despite continued population growth.
Confounding Factors and Interpretive Caveats
This correlation is almost certainly a classic case of spurious correlation driven by a shared confounding variable: time. Both U.S. population and software investment are driven upward by the passage of time — population through natural growth, and software investment through technological maturation, institutional development, and macroeconomic expansion. The near-total absence of Granger causality confirms neither series meaningfully predicts the other in a temporal sense once their own lagged dynamics are accounted for. Additional confounders include GDP growth, interest rate environments (low rates dramatically inflated VC activity post-2008), the invention and commercialization of the internet, and structural shifts in the venture capital industry itself. The linear model also likely misspecifies the true functional form, as software investment appears to accelerate non-linearly relative to population growth.
Actionable Insights and Further Investigation
Given the null Granger causality findings, analysts should avoid using population as a forecasting input for software investment or vice versa in any policy or investment model. Instead, future investigation should detrend both series (e.g., using first differences or percentage changes) to isolate whether any genuine co-movement exists beyond shared time trends. It would be valuable to test this correlation against alternative predictors more theoretically linked to VC software investment — such as real interest rates, GDP per capita, or the count of computer science graduates. Additionally, fitting a non-linear model (exponential or piecewise regression) may better capture the apparent inflection point around 250–270 million population. Segmenting the data into pre- and post-internet eras would also help determine whether the apparent relationship is stable or an artifact of a single structural break in the mid-1990s.
X dataset: Population, Total for United States (POPTOTUSA647NWDB)
Y dataset: Venture Capital Investment in Software
Part of experiment: Yearly - Population, Total for United States (POPTOTUSA647NWDB) vs Venture Capital Investment in Software