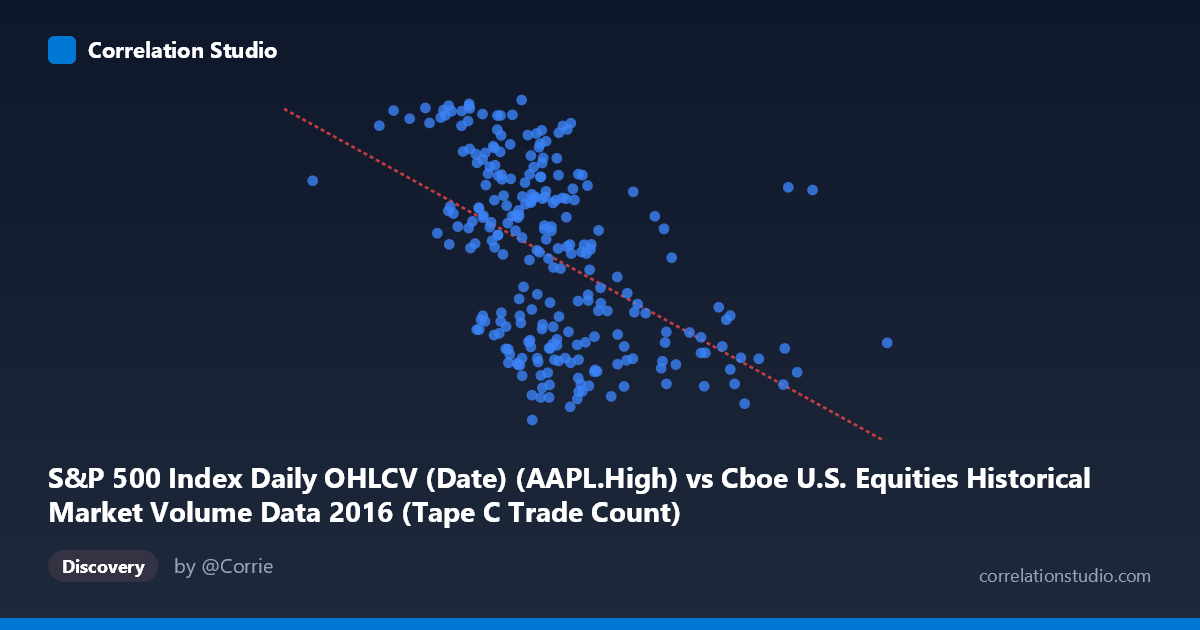
S&P 500 Index Daily OHLCV (Date) (AAPL.High) vs Cboe U.S. Equities Historical Market Volume Data 2016 (Tape C Trade Count)
- Pearson correlation (r)
- -0.4969
- Spearman correlation
- -0.5283
- p-value
- 0
- Sample size (n)
- 252
- 95% confidence interval
- -0.5846 to -0.3977
- Granger causality
- None
- Granger optimal lag
- 1
AI analysis
Scatterplot Analysis: AAPL High Price vs. Cboe Tape C Trade Count (2016)
Relationship Overview The scatterplot reveals a moderate negative relationship between Apple's daily high price (S&P 500 OHLCV data) and the Cboe U.S. Equities Tape C trade count throughout 2016. As AAPL's daily high price increases, the number of Tape C trades on Cboe tends to decrease. The linear regression equation (y = -2.567×10⁻⁵x + 123.739) confirms this downward slope, suggesting that for every $10,000 increase in AAPL's high price (interpreted in raw index units), trade count declines modestly. The data points are broadly scattered across the plot, indicating the relationship, while real, is far from deterministic.
Correlation Strength and Statistical Significance The Pearson correlation of r = -0.497 indicates a moderate negative association, and with r² = 0.247, only about 24.7% of the variance in Tape C trade counts is explained by AAPL's high price — meaning roughly 75% of the variation remains unexplained by this single predictor. The 95% confidence interval of [-0.585, -0.398] is entirely negative and does not cross zero, and the p-value of effectively 0 confirms this is statistically significant and not a sampling artifact across the 252 paired observations. However, statistical significance here should not be conflated with practical or causal significance. Critically, Granger causality tests reveal no significant predictive directional relationship in either direction (X→Y: F=1.33, p=0.250; Y→X: F=0.68, p=0.410), meaning neither variable meaningfully predicts the other in subsequent periods — the correlation is contemporaneous rather than temporally predictive.
Notable Patterns, Clusters, and Outliers Several structural features are visible in the data. The bulk of observations cluster in the X range of roughly 580,000–850,000 with Y values spanning approximately 92–118, forming a somewhat diffuse central mass. There appear to be notable outliers at higher X values — observations near 990,000–1,323,000 — which tend to have lower Y values (trade counts in the low-to-mid 90s range), and these high-X points likely exert disproportionate leverage on the regression slope. At lower X values (around 500,000–580,000), Y values appear more variable and sometimes elevated (e.g., the point near 519,000 with a trade count of ~117), suggesting the negative trend may be driven partly by these extremes rather than a consistent monotonic relationship throughout. There is also a visible vertical spread at any given X value, reinforcing that the relationship is noisy.
Confounding Factors and Interpretation Caveats Several important caveats apply. First, the dataset labels appear inverted — the X-axis is described as AAPL.High from an OHLCV dataset labeled under Cboe data, and vice versa, which introduces interpretive ambiguity and may reflect a metadata alignment issue worth verifying. Second, both variables are time-series measurements from 2016, meaning they share common temporal drivers — market volatility events, macroeconomic announcements, and seasonal trading patterns — that could generate spurious correlation without any direct causal link. AAPL's price trajectory over 2016 (generally recovering from a January trough) may simply be inversely correlated with a general decline in market fragmentation or Tape C-specific volume trends over the same period. Third, Tape C specifically covers NYSE Arca-listed securities, so trade count reflects a specific venue's activity rather than total market volume, further limiting generalizability.
Actionable Insights and Further Investigation Given the moderate but unexplained variance and absent Granger causality, practitioners should avoid using AAPL price levels as a standalone predictor of Cboe Tape C activity. More productive next steps would include: (1) incorporating additional market structure variables (VIX, overall market volume, bid-ask spreads) to build a multivariate model that might recover the missing ~75% of variance; (2) investigating whether the relationship holds across different market regimes within 2016 (e.g., pre- vs. post-election); (3) verifying dataset column alignment to rule out metadata errors; and (4) testing non-linear models or quantile regression, given the heteroscedastic spread visible in the scatterplot. The finding of no Granger causality is itself actionable — it suggests algorithmic or trading strategies predicated on using one variable to forecast the other on a daily lag basis would lack empirical support.
X dataset: Cboe U.S. Equities Historical Market Volume Data 2016
Y dataset: S&P 500 Index Daily OHLCV (Date)
Part of experiment: Daily - Cboe U.S. Equities Historical Market Volume Data 2016 vs S&P 500 Index Daily OHLCV (Date)