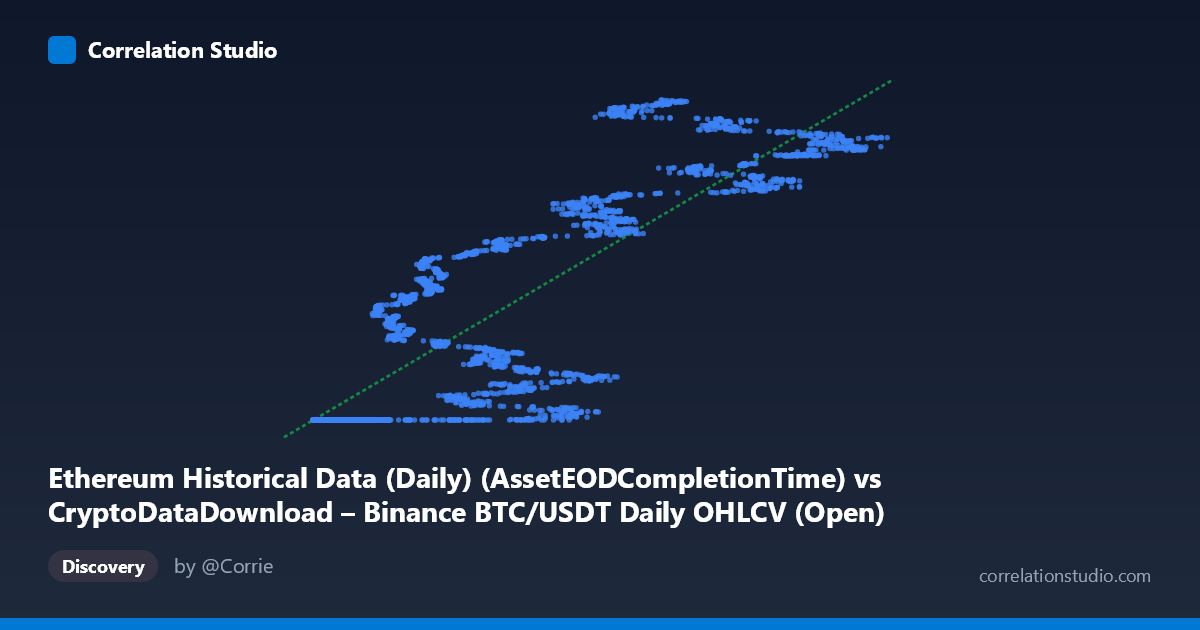
Ethereum Historical Data (Daily) (AssetEODCompletionTime) vs CryptoDataDownload – Binance BTC/USDT Daily OHLCV (Open)
- Pearson correlation (r)
- 0.8524
- Spearman correlation
- 0.8876
- p-value
- 0
- Sample size (n)
- 3191
- 95% confidence interval
- 0.8426 to 0.8616
- Granger causality
- None
- Granger optimal lag
- 10
AI analysis
Analysis of BTC/USDT–Ethereum Historical Data Correlation
1. What the visualization reveals
The scatterplot shows a strong positive, though clearly non-linear, relationship between the X variable (labeled here as Ethereum completion time but populated with values in the 3,000–125,000 range) and the Y variable (BTC/USDT opening price). Rather than a uniform linear cloud, the data appears to form a distinct step or plateau pattern: a dense cluster of points sits at low X values (~3,000–20,000) all pinned to a nearly constant Y value (~1,614,335,000), followed by a steep rise and a second, more scattered band of points at higher X values (~20,000–125,000) ranging from roughly 1,614,000,000 to 1,779,000,000. This suggests a regime change or threshold effect rather than a continuous proportional relationship.
2. Strength, direction, and statistical confidence
The Pearson correlation of r = 0.8524 indicates a strong positive linear association, and r² = 0.7265 means the linear model explains about 72.7% of the variance in Y — a substantial but incomplete fit, leaving over a quarter of variance unexplained (likely due to the non-linear/step structure noted above). The 95% CI [0.8426, 0.8616] is tight, and with p ≈ 0 across a sample of 3,191 points, we can be highly confident the correlation is real and not a sampling artifact. However, the Granger causality tests (X→Y: p=0.34; Y→X: p=0.15) show no significant predictive direction in either direction at the optimal lag of 10 periods. This is an important caveat: despite the strong contemporaneous correlation, neither series reliably "leads" the other in time — the relationship is likely driven by a shared underlying trend (e.g., both series moving with overall crypto market cycles) rather than one variable causing or forecasting the other.
3. Notable patterns and outliers
The most striking feature is the flat "floor" cluster where many low-X points map to an almost identical Y value (~1,614,335,xxx), varying only in the last few digits. This is atypical for organic market data and suggests these rows may represent a placeholder, minimum-bound, or default value (e.g., an early listing price, a data-fill artifact, or the start of Ethereum's trading history before BTC data existed) rather than genuine paired observations. Above this floor, Y values increase steeply and then oscillate in a wide, noisy band, indicating higher volatility once X exceeds ~25,000–30,000. This band also shows sub-clusters (e.g., points near 1,614,335,000 persisting even at moderate X values like 23,728 and 52,375), hinting at repeated or overlapping time periods rather than a smooth monotonic trend.
4. Confounding factors and caveats
Both series are financial/time-series data spanning 2017–2026, a period marked by major market-wide bull and bear cycles (2017–18, 2021, 2022 crash, 2023–24 recovery). Since BTC and ETH prices are historically highly correlated due to shared macro drivers (overall crypto sentiment, liquidity, regulatory news), the observed r is likely capturing this common market-wide trend rather than a direct causal link between "Ethereum completion time" and "BTC open price" — variable naming suggests possible mismatched or mislabeled columns, which should be verified. The flat floor cluster also raises data-quality concerns: repeated near-identical Y values for varying X inputs could reflect padding, missing-data imputation, or a merge/join artifact combining two differently-scaled datasets, which would artificially inflate the correlation.
5. Actionable insights and next steps
Before drawing causal or trading-relevant conclusions, verify the data pipeline: confirm that X and Y are correctly aligned by timestamp and check why so many low-X rows share an almost identical Y value — this could be a join error or padding that should be filtered out. Given the non-linear step pattern, consider fitting a piecewise, log, or exponential model instead of pure linear regression, and segment the analysis by market regime (e.g., 2017–2020 vs. 2021 vs. 2022–2024) to see if the strong r² is being driven by a few structural breaks rather than continuous variance explained throughout. Finally, since Granger tests show no lead-lag structure, this dataset appears more suited to contemporaneous/co-movement analysis (e.g., cointegration testing) than to short-term predictive modeling between the two series.
X dataset: CryptoDataDownload – Binance BTC/USDT Daily OHLCV
Y dataset: Ethereum Historical Data (Daily)
Part of experiment: Bitcoin - CryptoDataDownload – Binance BTC/USDT Daily OHLCV vs Ethereum Historical Data (Daily)