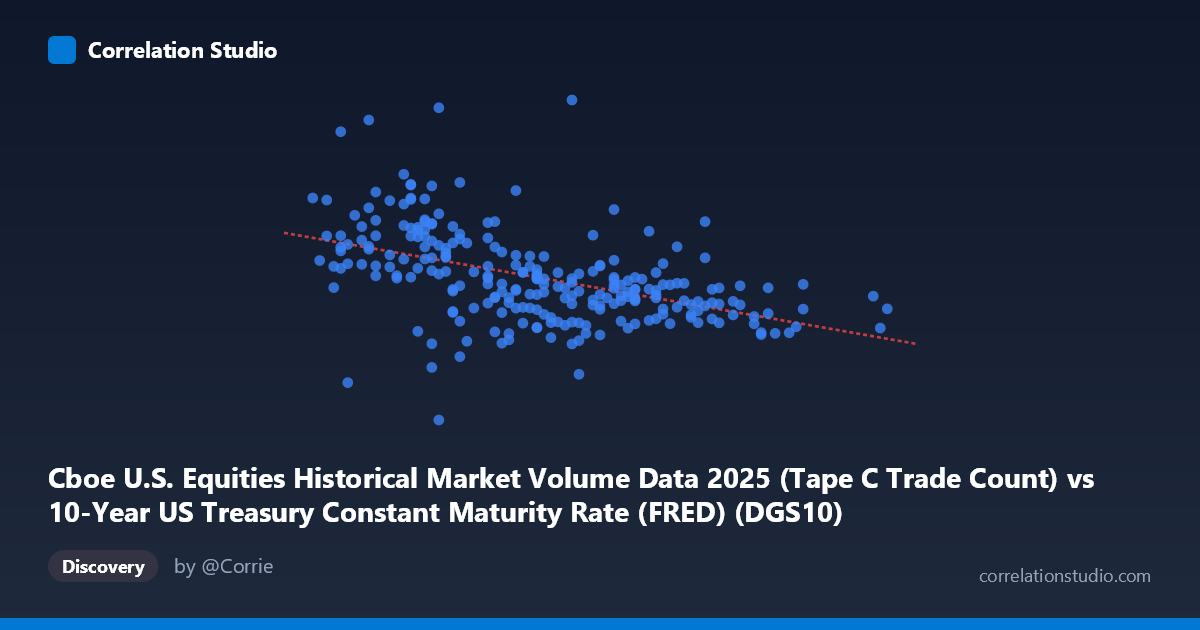
Cboe U.S. Equities Historical Market Volume Data 2025 (Tape C Trade Count) vs 10-Year US Treasury Constant Maturity Rate (FRED) (DGS10)
- Pearson correlation (r)
- -0.4786
- Spearman correlation
- -0.5578
- p-value
- 0
- Sample size (n)
- 248
- 95% confidence interval
- -0.5692 to -0.3765
- Granger causality
- None
- Granger optimal lag
- 10
AI analysis
Analysis: 10-Year Treasury Yield vs. Cboe Equity Trade Count (2025)
Relationship Overview
The scatterplot reveals a moderate negative relationship between the 10-year US Treasury constant maturity rate (X-axis) and Cboe U.S. equity trade counts (Y-axis) across 2025. As Treasury yields rise, equity trade counts tend to decline, and the linear regression equation (y = -1,246,470x + 8,092,970) quantifies this: each 1 percentage point increase in the 10-year yield is associated with approximately 1.25 million fewer trades. Visually, the downward-sloping trend is discernible but the scatter is substantial, indicating meaningful dispersion around the fitted line and suggesting that yield alone is far from a complete explanation of trading activity.
Correlation Strength and Statistical Significance
The Pearson correlation of r = -0.479 reflects a moderate negative association, but the more informative statistic is r² = 0.229, meaning Treasury yields explain only about 22.9% of the variance in trade counts — leaving roughly 77% attributable to other factors. The 95% confidence interval of [-0.569, -0.377] is entirely negative and reasonably tight given n = 248, providing strong evidence that the true population relationship is genuinely inverse. The p-value of 1.33 × 10⁻¹⁵ confirms this is not a chance finding. However, the Granger causality results are unambiguous in their null finding: neither direction (X→Y nor Y→X) achieves significance at any lag up to 10 periods (F = 1.14, p = 0.33 for yield predicting trades; F = 0.56, p = 0.85 for the reverse). This means that while a contemporaneous correlation exists, neither variable reliably predicts the other's future values, which critically limits any causal or forecasting interpretation.
Patterns, Clusters, and Outliers
Several features stand out in the data. There is a visible cluster of elevated trade counts (≥3.0M–4.5M) concentrated in the lower yield range (4.00–4.20%), consistent with the broader negative trend. At the upper yield range (4.50–4.70%), trade counts are more tightly compressed between approximately 2.1M–2.6M, suggesting reduced but more homogeneous activity. A handful of notable high-leverage outliers are visible: the point near (4.05, 4,338,307) represents exceptionally high trading volume at a relatively low yield, and (4.15, 1,299,442) is a significant low-volume outlier that bucks the general pattern for its yield level. These outliers — particularly the extreme high-volume observation — may disproportionately influence the regression slope and warrant individual investigation for event-driven explanations (e.g., index rebalancing days, macro announcements).
Confounding Factors and Caveats
Several important caveats temper this analysis. First, the yield range is narrow (3.97–4.79%), a roughly 82 basis point band, meaning conclusions may not generalize outside 2025's rate environment. Second, equity trade volume is driven by a rich set of factors — volatility regimes (VIX spikes), earnings seasons, macroeconomic data releases, and options expiration cycles — all of which can temporarily overwhelm any yield-driven signal. Third, the Granger non-causality result suggests the observed correlation may be largely spurious or coincidental, potentially reflecting a shared common driver (e.g., risk-off/risk-on sentiment simultaneously compressing yields and reducing speculative trading) rather than a direct mechanism. The dataset label mismatch in the axis descriptions also warrants attention: the column names appear swapped between datasets, and confirming the correct variable assignment is essential before drawing firm conclusions.
Actionable Insights and Further Investigation
Given these findings, several follow-up investigations would add substantial value. Controlling for realized volatility (VIX) as a mediating variable would help determine whether the yield-volume relationship survives or vanishes once market stress is accounted for. Segmenting by market regime — periods of rising vs. falling yields — might reveal asymmetric effects not visible in a pooled regression. Since Granger causality failed at lags up to 10, testing longer lags or alternative nonlinear models (e.g., threshold regression, polynomial terms) could uncover delayed or non-monotonic dynamics. Finally, examining Tape A and Tape B trade counts separately alongside Tape C could reveal whether this pattern is exchange-specific or market-wide, while adding options expiration dates and FOMC meeting dates as dummy variables could isolate discrete event-driven spikes from the underlying structural relationship.
X dataset: 10-Year US Treasury Constant Maturity Rate (FRED)
Y dataset: Cboe U.S. Equities Historical Market Volume Data 2025
Part of experiment: Daily - 10-Year US Treasury Constant Maturity Rate (FRED) vs Cboe U.S. Equities Historical Market Volume Data 2025