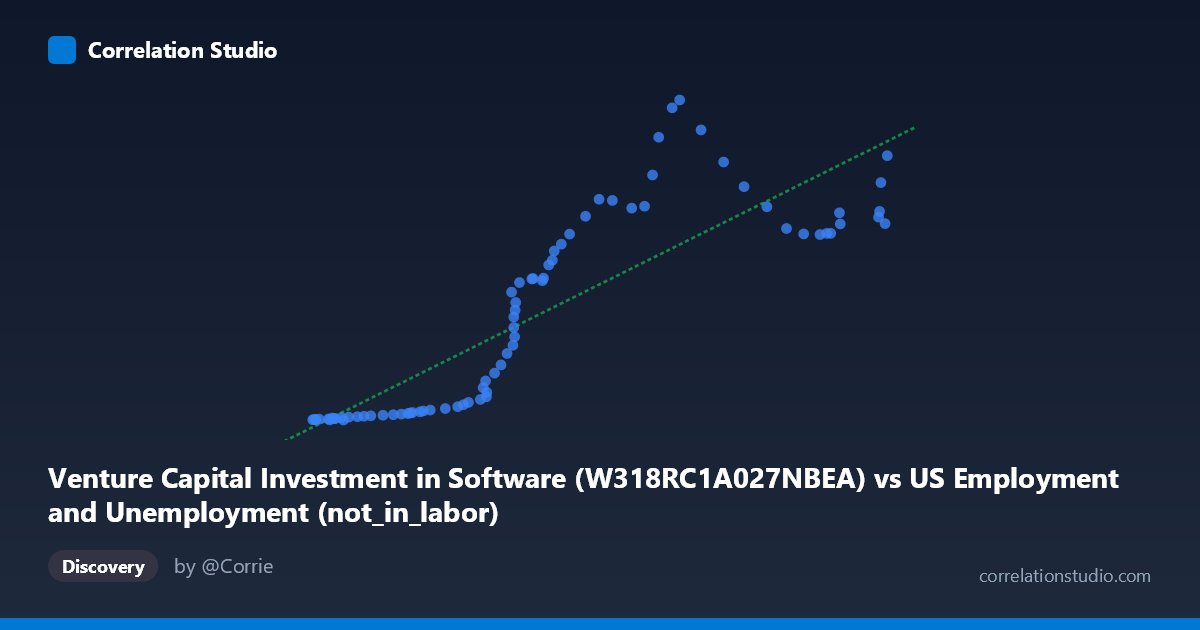
Venture Capital Investment in Software (W318RC1A027NBEA) vs US Employment and Unemployment (not_in_labor)
- Pearson correlation (r)
- 0.8569
- Spearman correlation
- 0.9539
- p-value
- 0
- Sample size (n)
- 79
- 95% confidence interval
- 0.7845 to 0.9063
- Granger causality
- None
- Granger optimal lag
- 10
AI analysis
Scatterplot Analysis: Venture Capital Software Investment vs. Labor Force Non-Participation
1. Overall Relationship Pattern
The scatterplot reveals a moderately strong positive association between Venture Capital Investment in Software (X-axis) and the "not in labor force" population count (Y-axis) across the 1946–2024 time period. As software VC investment increases, the number of people not participating in the labor force also tends to rise. The linear regression equation (y = 0.00717x − 313.79) suggests that for every additional billion dollars in software VC investment, the not-in-labor-force population increases by approximately 0.00717 units (in whatever scale the Y variable is measured). However, the relationship is not perfectly linear — the data exhibits notable curvature and dispersion at higher X values, suggesting the true functional form may be more complex than a simple linear model captures.
2. Correlation Strength, Direction, and Temporal Predictive Power
The Pearson correlation of r = 0.857 indicates a strong positive relationship, and the R² of 0.734 means that approximately 73.4% of the variance in labor force non-participation is statistically explained by VC software investment levels. This is a numerically impressive figure, though it warrants careful interpretation (see caveats below). The 95% confidence interval of [0.785, 0.906] is relatively narrow and sits well above zero, reinforcing that the correlation is robust and not an artifact of sampling variability. The p-value of essentially 0 confirms strong statistical significance for a sample of n = 79 annual observations.
Critically, however, the Granger causality tests reveal no significant predictive directionality in either direction — neither X→Y (F = 0.699, p = 0.721) nor Y→X (F = 0.687, p = 0.731) achieves significance, even at an optimal lag of 10 periods. This is an important finding: despite the strong contemporaneous correlation, neither variable temporally predicts the other in the Granger sense. This means the correlation almost certainly reflects a shared common driver — most likely secular time trends — rather than any direct causal mechanism between software investment and labor force participation.
3. Notable Patterns, Clusters, and Outliers
The data displays several structural features worth noting:
- A lower-left cluster of points with low VC investment (X ≈ 42,000–55,000) and very low Y values (0.85–20), which appear tightly packed and consistent — these likely represent earlier decades when both variables were at baseline levels. - A middle-range spread (X ≈ 58,000–70,000) where Y values scatter widely (roughly 20–275), suggesting high variability or a possible inflection zone where the relationship becomes less deterministic. - Potential outliers at high Y values with moderate X: points near (78,743, 455), (79,501, 466), (77,387, 412), and (81,659, 423) show disproportionately high Y relative to their X position, pulling above the regression line and suggesting heteroscedasticity — variance in Y increases substantially as X grows. - A flattening tendency at very high X values (X 90,000): several points cluster around Y ≈ 270–385 despite spanning a wide X range (90,000–100,465), hinting at a possible saturation or plateau effect in the not-in-labor-force measure that a linear model cannot adequately capture.
4. Confounding Factors and Interpretation Caveats
This correlation almost certainly suffers from spurious correlation driven by shared time trends. Both variables — VC software investment and labor force non-participation — have trended upward over recent decades due to entirely independent structural forces. VC software investment has grown due to technological innovation cycles, low interest rate environments, and the digital economy boom. Labor force non-participation has grown due to demographic aging (Baby Boomer retirements), rising disability rates, expanded Social Security and Medicare enrollment, and shifting participation patterns among prime-age workers. The absence of Granger causality strongly supports the interpretation that these two variables are coincidentally correlated time series rather than causally linked.
Additional caveats include: the dataset and axis labels appear to have been inadvertently swapped in the metadata (VC Investment is listed under "US Employment" dataset and vice versa), which warrants verification of data provenance. Furthermore, annual aggregation may mask important within-year dynamics, and the 79-year time span encompasses vastly different economic regimes, making stationarity assumptions questionable.
5. Actionable Insights and Further Investigation
Given the strong spurious correlation risk, the most important next step would be to detrend both time series (e.g., via first-differencing or applying Hodrick-Prescott filtering) and re-examine whether any correlation persists in the residuals. If the correlation disappears after detrending, it confirms spuriousness. Researchers should also consider controlling for confounders such as GDP growth, population size, and demographic composition (particularly the 65+ share of the population), which independently drive both variables. Running a multivariate regression with time as an explicit covariate would help isolate whether VC investment carries any independent explanatory power for labor force behavior. Finally, extending the Granger causality analysis with a VAR model on detrended series across multiple lag structures could provide a more definitive assessment of whether any temporal signal exists beneath the shared trend.
X dataset: US Employment and Unemployment
Y dataset: Venture Capital Investment in Software
Part of experiment: Yearly - US Employment and Unemployment vs Venture Capital Investment in Software