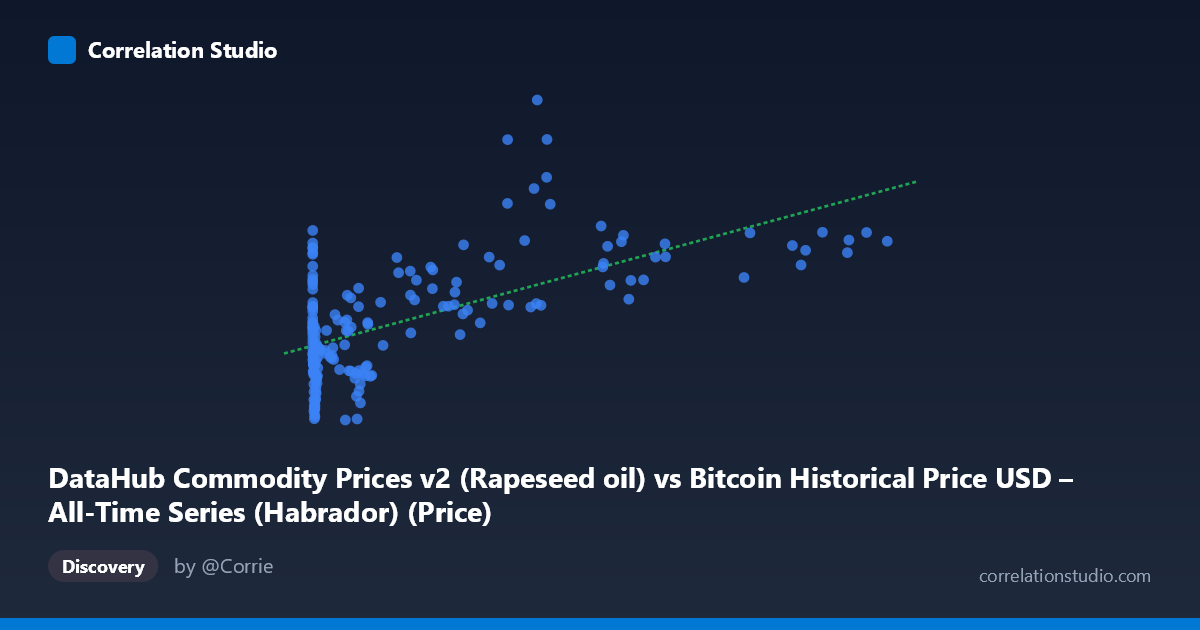
DataHub Commodity Prices v2 (Rapeseed oil) vs Bitcoin Historical Price USD – All-Time Series (Habrador) (Price)
- Pearson correlation (r)
- 0.6257
- Spearman correlation
- 0.4408
- p-value
- 0
- Sample size (n)
- 182
- 95% confidence interval
- 0.5283 to 0.7068
- Granger causality
- None
- Granger optimal lag
- 10
AI analysis
Analysis: Bitcoin Price vs. Rapeseed Oil Price
1. Relationship Overview
The scatterplot displays a positive but noisy relationship between Bitcoin's historical USD price (X-axis) and rapeseed oil commodity prices (Y-axis). The data spans an enormous range on the X-axis (from $0.06 to $113,500), reflecting Bitcoin's full price history from genesis through 2025, while Y values cluster in a much narrower band ($1,460–$3,498). This scale disparity means the relationship is heavily influenced by a small number of high-Bitcoin-price observations, with the bulk of points compressed near the origin.
2. Correlation Strength and Statistical Context
The correlation coefficient (r = 0.626) indicates a moderate positive linear association, with r² = 0.392 meaning only about 39% of the variance in rapeseed oil prices is statistically explained by Bitcoin price movements — leaving over 60% unexplained by this relationship alone. The 95% CI [0.528, 0.707] is reasonably tight and excludes zero, and the p-value of ~0 confirms this correlation is statistically significant and not due to chance. However, statistical significance should not be conflated with causal or economically meaningful linkage. Critically, the Granger causality tests show no significant predictive direction in either direction (X→Y: p=0.227; Y→X: p=0.651), meaning neither series reliably helps forecast the other's future values based on past values. This strongly suggests the correlation is likely driven by a shared underlying trend (e.g., both series rising over the 2010–2025 period due to inflation, time, or macro liquidity conditions) rather than any direct mechanistic relationship.
3. Notable Patterns and Outliers
The data shows a distinct non-linear, heteroscedastic pattern: at low Bitcoin prices (under ~$10,000), rapeseed oil prices vary widely (roughly $1,460–$2,300) with no clear trend, essentially forming a dense vertical cluster near X=0. Only as Bitcoin prices climb above $30,000–$40,000 does a clearer upward drift in Y appear, with several notable high-Y outliers (e.g., $44,354→$3,498 and $46,281→$3,247) suggesting a possible cluster tied to a specific time period (likely 2021 or 2024–2025 bull runs) where both series happened to peak together. This pattern is consistent with a time-trend co-movement rather than a true functional relationship — the linear fit (y = 0.00876x + 1933) is likely a poor descriptor for the low-X regime and is disproportionately pulled by the sparse high-X tail.
4. Confounding Factors and Caveats
The most obvious confound is time itself: both Bitcoin and commodity prices (including rapeseed oil) have experienced long-term upward trends over 2010–2025 due to independent factors — Bitcoin from adoption/speculation cycles, rapeseed oil from agricultural supply, biofuel demand, and general inflation. This shared temporal drift can produce spurious correlation even absent any causal link, and the Granger non-causality result supports this interpretation. Additionally, the extreme right-skew in X (mean $17,943 vs. median likely much lower) means a handful of high-Bitcoin-price data points exert outsized leverage on both r and the regression slope. Currency inflation (both series denominated in nominal USD) is another likely shared confound.
5. Recommendations for Further Investigation
Given the lack of Granger causality and the apparent shared-trend artifact, this correlation should not be used for predictive or trading purposes. To clarify the relationship, consider: (1) detrending both series or analyzing returns/percentage changes rather than levels to remove the shared time trend; (2) log-transforming Bitcoin price given its exponential growth and heavy right-skew, which would likely improve model fit and reduce leverage from extreme values; (3) checking for a third common driver (e.g., USD inflation index, global M2 money supply) that might explain co-movement in both series; and (4) segmenting the analysis by distinct market regimes (pre-2017, 2017–2021, 2021–2025) to see if the relationship is stable or an artifact of specific overlapping bull/bear cycles.
X dataset: Bitcoin Historical Price USD – All-Time Series (Habrador)
Y dataset: DataHub Commodity Prices v2
Part of experiment: Bitcoin - Bitcoin Historical Price USD – All-Time Series (Habrador) vs DataHub Commodity Prices v2