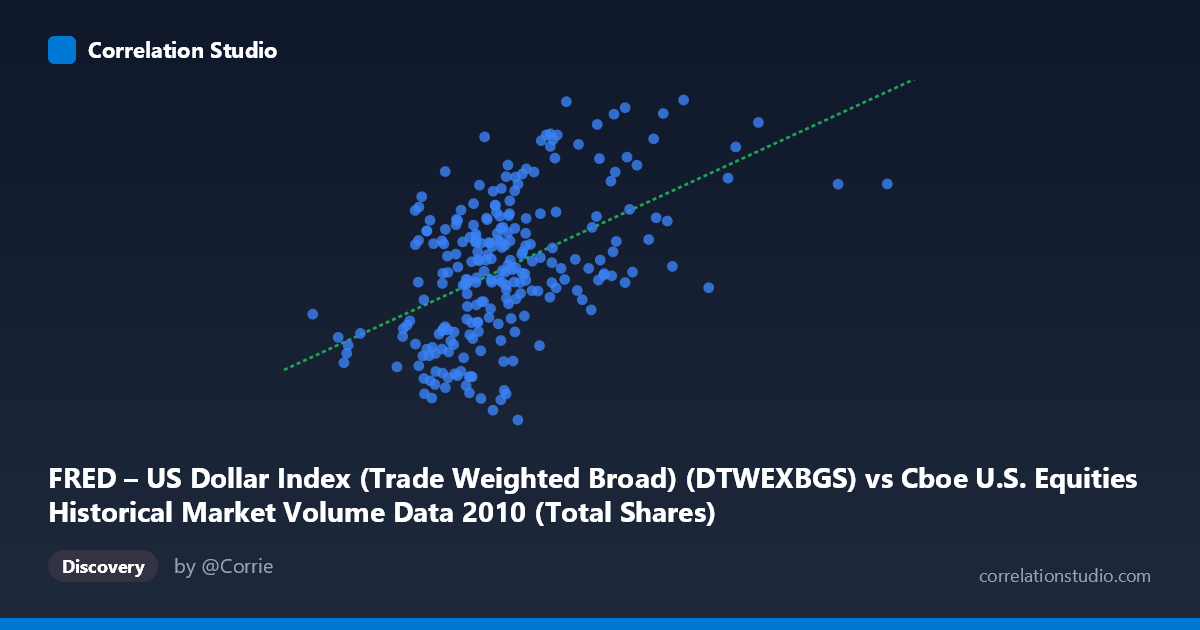
FRED – US Dollar Index (Trade Weighted Broad) (DTWEXBGS) vs Cboe U.S. Equities Historical Market Volume Data 2010 (Total Shares)
- Pearson correlation (r)
- 0.5072
- Spearman correlation
- 0.4853
- p-value
- 0
- Sample size (n)
- 245
- 95% confidence interval
- 0.4078 to 0.5947
- Granger causality
- None
- Granger optimal lag
- 1
AI analysis
Scatterplot Analysis: US Dollar Index vs. Cboe US Equities Market Volume (2010)
Relationship Overview The scatterplot reveals a moderate positive relationship between the Trade Weighted Broad US Dollar Index (X-axis) and Total Shares traded on Cboe US Equities exchanges (Y-axis) across 245 trading days in 2010. As the dollar index increases, total share volume tends to rise, which is somewhat counterintuitive at face value — a stronger dollar is typically associated with reduced export competitiveness and equity market headwinds. The linear regression equation (y = 5.03×10⁻⁹x + 89.73) confirms a positive but extremely shallow slope, reflecting the vast scale difference between the two variables. The data spans a single calendar year (January–December 2010), which importantly constrains generalizability.
Correlation Strength and Statistical Significance The Pearson correlation of r = 0.507 indicates a moderate positive association, but the more telling statistic is r² = 0.257, meaning only 25.7% of the variance in equity share volume is explained by the dollar index. Nearly three-quarters of the variation in trading volume is driven by other factors entirely. The 95% confidence interval of [0.408, 0.595] is reasonably tight and excludes zero, and the p-value of effectively 0 confirms the result is highly statistically significant given the sample of 245 paired observations drawn from a population of 3,302. However, statistical significance here is largely a function of sample size and should not be conflated with practical or economic significance. Critically, the Granger causality analysis finds no significant predictive directionality in either direction at the optimal 1-period lag — X→Y yields F = 0.27 (p = 0.60) and Y→X yields F = 3.45 (p = 0.064). Neither variable meaningfully predicts the other temporally, which strongly cautions against any causal interpretation of this correlation.
Notable Patterns, Clusters, and Outliers The sample points reveal several structural features worth noting. The bulk of observations cluster in the X range of roughly 540M–900M with Y values between approximately 90–95, forming a dense central mass. However, there are notable high-X outliers — points near 1.1–1.6 billion on the dollar index axis (e.g., 1,476,963,723 at Y = 95.30; 1,098,045,035 at Y = 97.55) — that appear to exert leverage on the positive slope without clearly fitting the central pattern. Several high-Y values (97.34, 97.50, 97.55, 97.17) appear scattered across a wide range of X values, suggesting that peak share volume days are not tightly coupled to specific dollar index levels. There is also a lower-left cluster (X < 500M, Y ~89–92) that anchors the regression's positive trend but may reflect structurally different market conditions rather than a true continuous relationship.
Confounding Factors and Caveats This correlation almost certainly reflects shared temporal trends rather than a direct economic mechanism. Both variables in 2010 were influenced by macro-level events — the European sovereign debt crisis, Federal Reserve quantitative easing, and risk-on/risk-off dynamics — that drove both dollar strength and equity market volatility (and thus volume) simultaneously. This is a classic spurious correlation via common cause: a third variable (macro risk sentiment or Fed policy) likely drives both. Additionally, the axis labels appear to have been swapped in the dataset metadata (the dollar index is labeled as the Y-axis source dataset and vice versa), which warrants careful verification before drawing conclusions. The single-year window (2010) also means results may be highly regime-specific and not transferable to other periods.
Actionable Insights and Further Investigation Given the moderate correlation but absent Granger causality, practitioners should not use the dollar index as a short-term predictor of daily equity volume. However, the co-movement warrants deeper investigation at longer time scales. Recommended next steps include: (1) expanding the analysis to multi-year data to test whether the 2010 relationship holds across different macro regimes; (2) introducing a risk sentiment proxy (e.g., VIX) as a control variable to test whether the X-Y correlation dissolves under partial correlation analysis; (3) testing non-linear model specifications, as the scatter suggests heteroscedasticity and potential threshold effects at extreme dollar index values; and (4) verifying the axis/dataset label alignment, as a metadata swap would fundamentally alter the economic interpretation. The 74% unexplained variance is the most actionable finding — it signals that a multi-factor model incorporating volatility, market breadth, and institutional flow data would substantially improve explanatory power.
X dataset: Cboe U.S. Equities Historical Market Volume Data 2010
Y dataset: FRED – US Dollar Index (Trade Weighted Broad)
Part of experiment: Daily - Cboe U.S. Equities Historical Market Volume Data 2010 vs FRED – US Dollar Index (Trade Weighted Broad)