Ethereum Historical Data (Daily) (SplyCur) vs CryptoDataDownload – Binance BTC/USDT Daily OHLCV (Unix)
- Pearson correlation (r)
- 0.9166
- Spearman correlation
- 0.9687
- p-value
- 0
- Sample size (n)
- 3191
- 95% confidence interval
- 0.9109 to 0.922
- Granger causality
- None
- Granger optimal lag
- 10
AI analysis
Analysis: Ethereum Supply vs. Time-Correlated Metric
1. What the Visualization Reveals
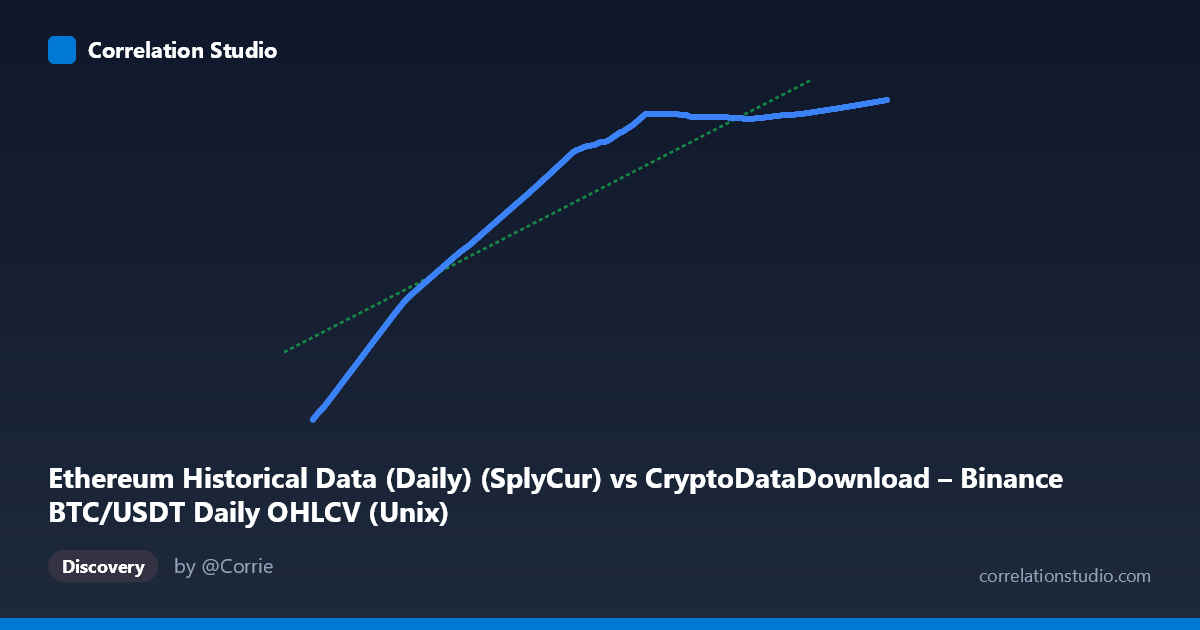
Despite the column labels appearing to reference OHLCV price data, the actual X-axis values (ranging from ~1.50 to 1.78 trillion, representing Unix timestamps from August 2017 to May 2026) indicate this is fundamentally a time-series relationship rather than a price-to-price comparison. The Y-axis (94M–121.7M) aligns with Ethereum's circulating supply (SplyCur), which grows monotonically over time due to block issuance. The scatterplot therefore essentially shows ETH circulating supply plotted against time itself, producing a strong but non-stationary trend rather than a genuine cross-asset correlation.
2. Strength, Direction, and Uncertainty
The correlation is strong and positive (r = 0.9166, r² = 0.8402), meaning ~84% of the variance in Y (ETH supply) is statistically explained by X (time/timestamp progression). The tight confidence interval [0.9109, 0.9220] and p-value of 0 confirm this relationship is highly stable and not due to sampling noise — with n = 3,191 points, even modest correlations would reach significance, so the effect size here is genuinely large. However, the Granger causality results are critical context: neither variable predicts the other (X→Y: p=0.438; Y→X: p=0.920). This confirms the correlation is not driven by one variable temporally leading the other in a predictive sense — it's a shared trend artifact, not a causal or lead-lag dynamic. This is expected, since ETH supply increases deterministically via protocol issuance rules, not in response to BTC price movements.
3. Notable Patterns and Non-Linear Features
The sample points reveal a clear piecewise/logistic growth curve, not a straight line: - 2017–2019: Rapid, steep increase (94M → ~100M) - 2019–2021: Continued climb with slight deceleration (100M → ~113M) - 2021–2024: Sharp deceleration, appearing to plateau near 120M - 2024–2026: Near-flat asymptotic behavior (120M → 121.7M)
This S-curve/logarithmic shape reflects Ethereum's issuance schedule, especially the transition from Proof-of-Work to Proof-of-Stake (The Merge, Sept 2022) and EIP-1559 fee-burning, both of which drastically reduced net new ETH issuance. The linear regression (R²=0.84) is a "curve compromise" — it fits the general upward direction but leaves systematic residual patterns, meaning a logarithmic, logistic, or piecewise model would substantially outperform the linear fit, likely pushing effective R² above 0.95+.
4. Confounding Factors and Caveats
- Spurious/trend correlation: Any two monotonically trending time series will show high r purely from shared drift, regardless of causal connection. - Metadata mismatch: The dataset descriptions (BTC/USDT OHLCV) don't match the actual values plotted (timestamps vs. circulating supply), suggesting a data-labeling or column-alignment error that should be verified before drawing conclusions. - Structural breaks: The Merge (2022) fundamentally altered ETH's issuance mechanics, creating a regime change that a single linear or even smooth nonlinear model may not fully capture. - Non-stationarity: Both series are non-stationary (trending), which inflates correlation and can produce misleading Grangranger/regression statistics unless differenced.
5. Suggested Next Steps
1. Verify data provenance — confirm the axis/column labels are correct, since current metadata is inconsistent with the value ranges observed. 2. Re-run analysis on differenced/detrended series (e.g., daily supply change vs. daily price change) to test for genuine relationships once the shared time trend is removed. 3. Fit a logistic or piecewise-linear model with a breakpoint around Sept 2022 to capture the Merge-driven issuance change — this should meaningfully improve fit quality over the current linear model. 4. Treat the current r²/regression as descriptive only — given the null Granger results, this correlation should not be used for predictive or trading purposes; it reflects parallel trends, not actionable lead-lag signal.
X dataset: CryptoDataDownload – Binance BTC/USDT Daily OHLCV
Y dataset: Ethereum Historical Data (Daily)
Part of experiment: Bitcoin - CryptoDataDownload – Binance BTC/USDT Daily OHLCV vs Ethereum Historical Data (Daily)