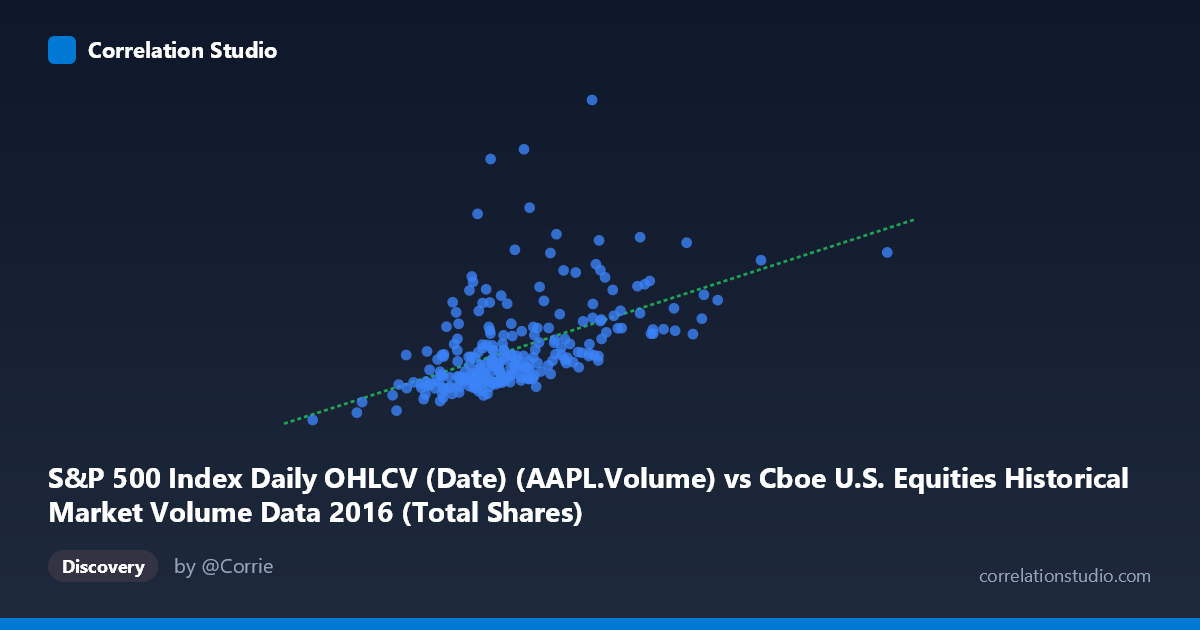
S&P 500 Index Daily OHLCV (Date) (AAPL.Volume) vs Cboe U.S. Equities Historical Market Volume Data 2016 (Total Shares)
- Pearson correlation (r)
- 0.5188
- Spearman correlation
- 0.6026
- p-value
- 0
- Sample size (n)
- 252
- 95% confidence interval
- 0.4223 to 0.6037
- Granger causality
- None
- Granger optimal lag
- 10
AI analysis
Analysis of AAPL Trading Volume vs. Cboe Total Market Shares (2016)
Relationship Overview The scatterplot reveals a moderate positive relationship between Apple's daily trading volume (S&P 500 OHLCV dataset) and total U.S. equity market shares traded (Cboe dataset) across 252 trading days in 2016. As AAPL volume increases, total market shares traded tend to rise as well, consistent with the intuition that high-activity days in a bellwether stock like Apple coincide with broader market participation. The linear regression equation (y = 0.0794x − 2.299×10⁶) suggests that for every additional AAPL share traded, total market volume increases by roughly 0.079 shares — a plausible scaling relationship given Apple's significant but partial weight within overall U.S. equity flow.
Correlation Strength and Statistical Significance The Pearson correlation of r = 0.5188 indicates a moderate positive association, but the coefficient of determination r² = 0.2692 is the more practically meaningful figure: only 26.9% of the variance in total Cboe market shares is explained by AAPL volume alone. This leaves roughly 73% of variance unexplained, underscoring that many other factors drive broad market activity. The 95% confidence interval [0.4223, 0.6037] is reasonably tight and does not include zero, and the p-value of effectively 0 confirms the correlation is highly statistically significant with a sample of n = 252. However, statistical significance here should not be conflated with practical predictive power — the relationship is real but far from deterministic.
Granger Causality and Temporal Direction Despite the significant contemporaneous correlation, the Granger causality tests find no significant predictive directionality in either direction (X→Y: F = 1.06, p = 0.39; Y→X: F = 0.94, p = 0.50), even at the optimal lag of 10 periods. This is a critical finding: knowing AAPL's trading volume today does not meaningfully help predict total market volume over the next 10 days, and vice versa. The relationship appears to be largely concurrent rather than causal or lead-lag in nature, suggesting both variables respond to the same underlying market conditions simultaneously rather than one driving the other through time.
Notable Patterns, Clusters, and Outliers The scatterplot shows a dense central cluster roughly between 400–600M AAPL shares and 20–60M total Cboe shares, indicating typical trading-day behavior. However, several notable outliers are visible: one point near (634M, 133M) stands dramatically above the regression line, and another cluster around (537M, 92M) also deviates significantly upward. These likely correspond to event-driven days — earnings announcements, Federal Reserve decisions, or macroeconomic shocks — where market-wide volume surged independently of, or disproportionately to, AAPL activity. The wide vertical scatter at any given X value reinforces the modest r² and suggests heteroscedasticity, with variance in Y increasing at higher X values.
Caveats, Confounders, and Further Investigation Several confounding factors warrant caution. Both variables likely share common drivers — VIX (volatility index) spikes, index rebalancing events, options expiration dates, and macroeconomic announcements — that could inflate the apparent correlation without implying any direct link. Additionally, the axis labels appear swapped relative to dataset descriptions (AAPL Volume is labeled as originating from the Cboe dataset and vice versa), which merits data validation before drawing firm conclusions. For further investigation, it would be valuable to: (1) partial out volatility (VIX) as a covariate to isolate any residual AAPL-specific effect; (2) examine whether earnings release dates account disproportionately for the outlier points; (3) test the relationship against other mega-cap stocks to determine whether this is AAPL-specific or a general large-cap phenomenon; and (4) explore nonlinear models given the apparent heteroscedasticity, which may capture the relationship more accurately than OLS.
X dataset: Cboe U.S. Equities Historical Market Volume Data 2016
Y dataset: S&P 500 Index Daily OHLCV (Date)
Part of experiment: Daily - Cboe U.S. Equities Historical Market Volume Data 2016 vs S&P 500 Index Daily OHLCV (Date)