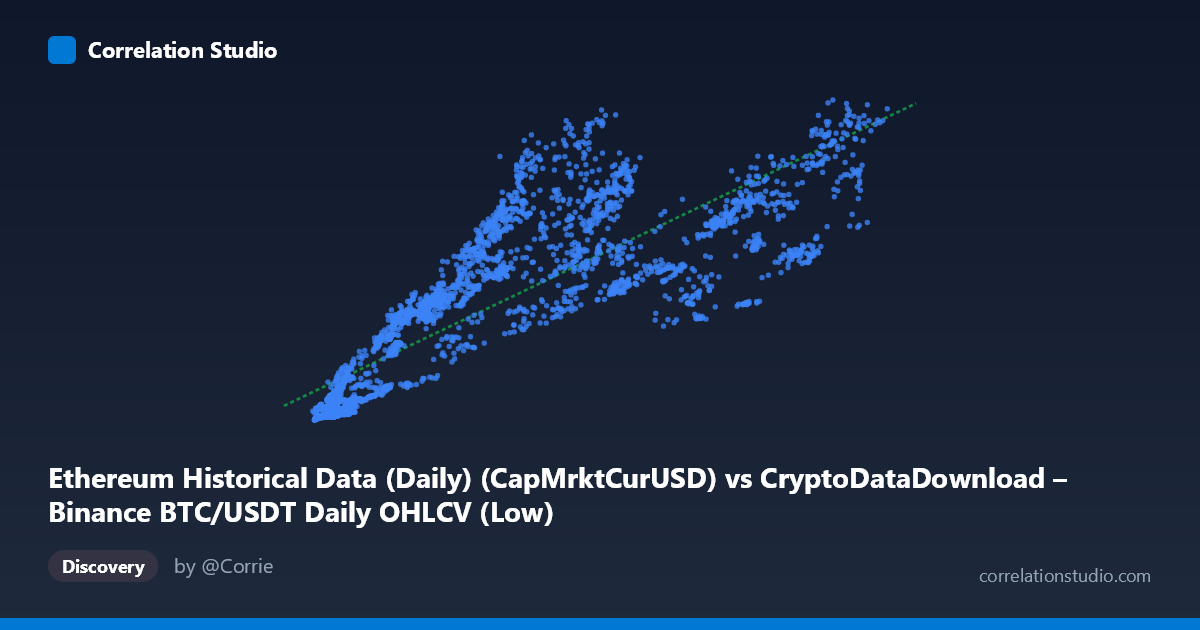
Ethereum Historical Data (Daily) (CapMrktCurUSD) vs CryptoDataDownload – Binance BTC/USDT Daily OHLCV (Low)
- Pearson correlation (r)
- 0.8464
- Spearman correlation
- 0.9124
- p-value
- 0
- Sample size (n)
- 3191
- 95% confidence interval
- 0.8363 to 0.856
- Granger causality
- None
- Granger optimal lag
- 10
AI analysis
Analysis: Ethereum Market Cap vs. Bitcoin/Ethereum Price Metrics
1. Relationship Overview
The scatterplot depicts a strong positive association between the X variable (labeled as Ethereum market capitalization, though the metadata suggests a possible mismatch with BTC/USDT OHLCV data) and Y (Ethereum's low price metric). As X increases from roughly 2,800 to 123,000, Y climbs from ~8.6 billion to ~585 billion, tracing a broadly linear upward trend. The fitted regression line (y = 4.116M·x + 47.2B) captures this trend reasonably well, though visual inspection of the sample points suggests meaningful scatter around the line, particularly in the low-to-mid X range (5,000–30,000), where Y values span an order of magnitude (e.g., X≈9,000 yields Y values from ~20B to ~102B).
2. Strength, Direction, and Statistical Confidence
The correlation coefficient (r = 0.846, r² = 0.716) indicates a strong positive linear relationship, with roughly 72% of the variance in Y statistically explained by X — a substantial but not complete association, leaving ~28% of variance driven by other factors or nonlinearity. The tight confidence interval [0.836, 0.860] and p-value of effectively 0 (from n=3,191) confirm this correlation is highly statistically robust and not a product of sampling noise. However, statistical significance and predictive/causal direction are distinct concepts: the Granger causality tests show no significant lead-lag predictive relationship in either direction (X→Y: p=0.664; Y→X: p=0.757). This is a critical finding — it means neither variable's past values help forecast the other's future values beyond what each series' own history provides. The strong contemporaneous correlation likely reflects both series responding to shared underlying market forces (e.g., overall crypto market sentiment, macro liquidity cycles) rather than one driving the other over time.
3. Notable Patterns and Outliers
Several non-linear features are visible: (a) at low X values (under 10,000), Y shows high relative volatility — some points sit far above the regression line (e.g., X≈9,900 → Y≈102B; X≈12,569 → Y≈132B) while neighbors with similar X sit much lower (~20-30B), suggesting a secondary driver or regime shift at low market-cap levels. (b) At high X values (90,000), the relationship appears to steepen, with Y values reaching 480-585B, hinting at possible convexity/acceleration rather than a strictly linear fit. (c) The data likely reflects distinct temporal clusters (bull/bear market phases from 2017-2026), which can create the appearance of a strong global correlation driven by shared trend/regime rather than a stable structural relationship.
4. Confounding Factors and Caveats
Given the time coverage (2017–2026), both series are almost certainly non-stationary time series with strong trends driven by common macro factors: overall crypto market cycles, Bitcoin dominance shifts, regulatory news, and broad risk-on/risk-off sentiment. This makes the observed r² highly susceptible to spurious correlation from shared trending behavior rather than genuine bivariate dependency — a classic issue in financial time-series correlation. Additionally, there's a notable metadata inconsistency: X is labeled as an Ethereum market-cap metric under a "BTC/USDT OHLCV" dataset heading, while Y is labeled as BTC/USDT "Low" price under an "Ethereum" dataset heading — this cross-labeling raises concerns about data provenance/alignment that should be verified before drawing strong conclusions.
5. Recommendations
Before treating this correlation as economically meaningful, (1) verify the data source labeling/alignment issue noted above; (2) test for cointegration (e.g., Engle-Granger) rather than relying on levels correlation, since both series are likely non-stationary; (3) re-run analysis on detrended or differenced (returns-based) series to check if the strong r² persists — if it weakens substantially, the original correlation was largely trend-driven; (4) given the lack of Granger causality, avoid using one series to forecast the other in a trading or predictive model; and (5) investigate the low-X volatility cluster and high-X convexity as potential regime-dependent relationships (e.g., separate bull vs. bear market regressions) rather than a single global linear fit.
X dataset: CryptoDataDownload – Binance BTC/USDT Daily OHLCV
Y dataset: Ethereum Historical Data (Daily)
Part of experiment: Bitcoin - CryptoDataDownload – Binance BTC/USDT Daily OHLCV vs Ethereum Historical Data (Daily)