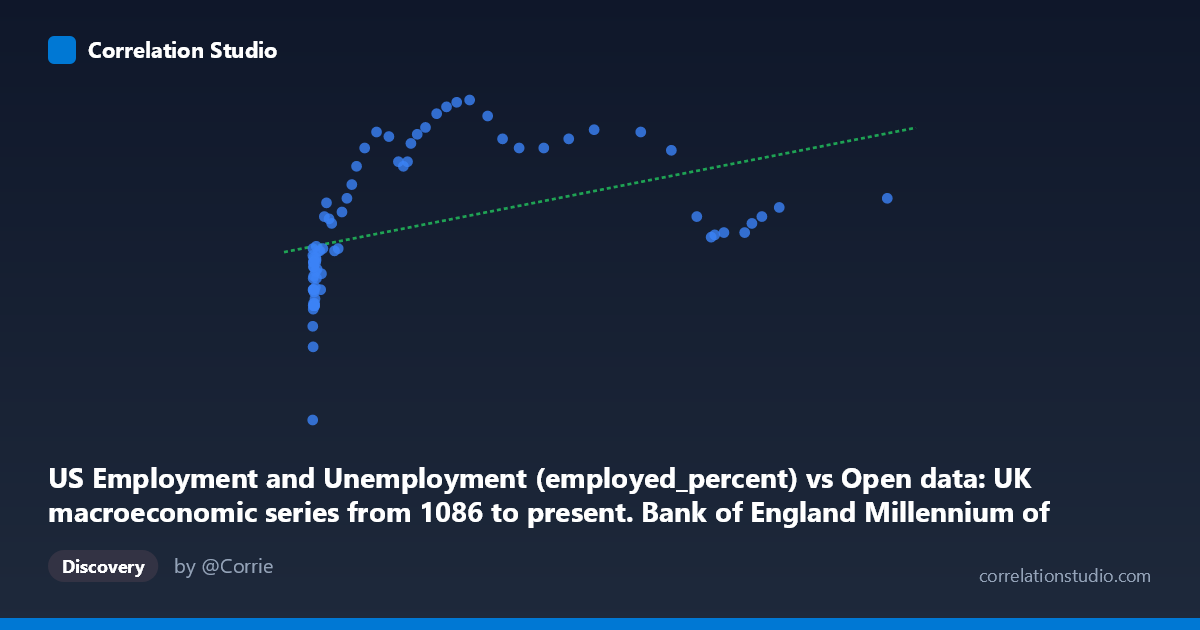
US Employment and Unemployment (employed_percent) vs Open data: UK macroeconomic series from 1086 to present. Bank of England Millennium of Macroeconomic Data. (Month) (value)
- Pearson correlation (r)
- 0.4312
- Spearman correlation
- 0.7932
- p-value
- 0.00009
- Sample size (n)
- 77
- 95% confidence interval
- 0.2294 to 0.5975
- Granger causality
- None
- Granger optimal lag
- 1
- Time coverage
- 1941-01-01 to 2017-01-01
AI analysis
Scatterplot Analysis: UK Macroeconomic Data vs. US Employment Rate
1. Overall Relationship Revealed
The scatterplot depicts a positive relationship between a UK macroeconomic variable (drawn from the Bank of England's Millennium dataset, plotted on the X-axis and exhibiting extreme right-skew with values ranging from ~164 to ~116,836) and the US employment percentage (Y-axis, ranging narrowly from 50.4% to 64.4%). The linear regression line (y = 4.24×10⁻⁵x + 57.98) confirms a modest upward trend: as the UK macroeconomic indicator rises, the US employment rate tends to drift slightly higher. However, the extremely compressed Y-axis range (~14 percentage points over 76 years, 1941–2017) and the heavily skewed X distribution mean the visual impression of a relationship is substantially shaped by a cluster of high-X observations pulling the regression line upward.
2. Correlation Strength, Explained Variance, and Causality
The Pearson correlation of r = 0.43 is statistically significant (p = 9.0×10⁻⁵), confirming this is unlikely to be a chance association. However, the R² of 0.186 means only 18.6% of the variance in US employment is explained by the UK indicator — the vast majority (80%) of variation is attributable to other factors entirely. The 95% confidence interval for r spans [0.23, 0.60], which, while excluding zero, is notably wide, reflecting meaningful uncertainty about the true strength of the relationship given the sample of 77 paired annual observations. Critically, the Granger causality analysis finds no significant predictive directionality: neither X→Y (F=1.17, p=0.282) nor Y→X (F=3.23, p=0.077) meets conventional significance thresholds at a single lag. This means there is no temporal evidence that either variable meaningfully predicts the other's future values, strongly cautioning against any causal interpretation.
3. Notable Patterns, Clusters, and Outliers
The data exhibits a clear bimodal distributional structure. A dense cluster of low-X values (roughly 164–7,000) corresponds to Y values concentrated around 55–60%, likely representing earlier decades (1940s–1970s) when the UK macroeconomic series may have been measured on a different scale or the economy operated in a different regime. A second, more dispersed cluster occupies X values from ~10,000 to ~116,836, corresponding to Y values generally between 58% and 64.4%, consistent with more recent decades of higher US employment participation. The point (164.44, 50.40) stands out as a clear outlier with the lowest values on both axes — likely an early wartime observation. Several high-X observations (e.g., 116,836/60.1; 94,899/59.7; 91,374/59.3) cluster in the upper-right but do not continue the upward employment trend, suggesting diminishing returns or a ceiling effect. The hint from Spearman ρ exceeding Pearson r confirms the relationship is better described by a logarithmic or monotonic non-linear function than a straight line.
4. Confounding Factors and Interpretive Caveats
Several serious caveats apply. First, both series are time-indexed (1941–2017), meaning the observed correlation may be largely a spurious trend correlation — two independently trending variables sharing temporal drift rather than any causal mechanism. Global economic growth, post-war recovery, and financialization trends simultaneously affect both economies, making it extremely difficult to isolate a genuine bilateral relationship. Second, the X-axis variable's identity is ambiguous — its extreme range (spanning three orders of magnitude) suggests it may be a nominal monetary series (e.g., money supply, GDP in millions) heavily distorted by inflation and currency changes over 76 years, making raw Pearson correlation inappropriate without deflation or log-transformation. Third, the units and scales of the two series come from fundamentally different national contexts (UK macroeconomic aggregates vs. US labor force participation), and any linkage would require a well-theorized transmission mechanism. The Granger non-result reinforces that no such mechanism is evident in the lagged structure of the data.
5. Actionable Insights and Further Investigation
Given the non-linear signal (Spearman Pearson), an immediate improvement would be to log-transform the X-axis variable and refit the regression, which would likely raise R² substantially and produce a more interpretable relationship. Researchers should also detrend both series (e.g., via first-differencing or HP filtering) to test whether any correlation survives the removal of shared secular trends — if it collapses toward zero, the current result is likely spurious. Extending the Granger causality test to multiple lags (beyond the single optimal lag tested here) and applying cointegration analysis (e.g., Engle-Granger or Johansen) would determine whether a stable long-run equilibrium relationship exists. Finally, identifying the specific UK macroeconomic series on the X-axis is essential — if it is a nominal monetary aggregate, deflating by CPI before analysis is non-negotiable. The current correlation, while statistically significant, should not be treated as evidence of a meaningful economic linkage without these additional analytical steps.
X dataset: Open data: UK macroeconomic series from 1086 to present. Bank of England Millennium of Macroeconomic Data. (Month)
Y dataset: US Employment and Unemployment
Part of experiment: Yearly - Open data: UK macroeconomic series from 1086 to present. Bank of England Millennium of Macroeconomic Data. (Month) vs US Employment and Unemployment