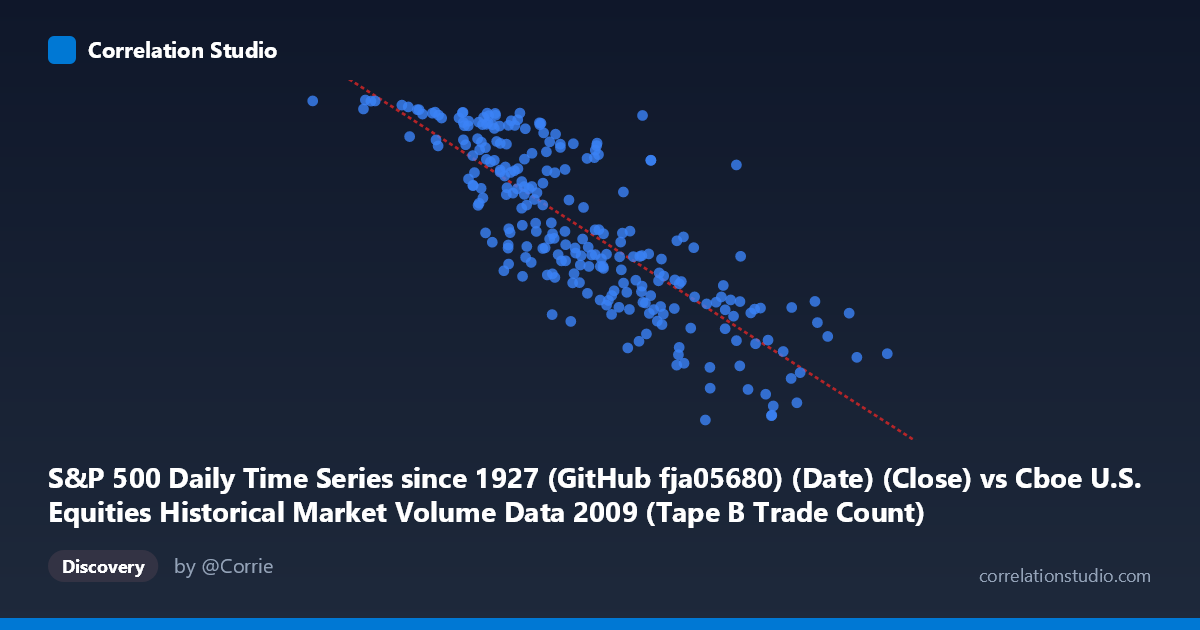
S&P 500 Daily Time Series since 1927 (GitHub fja05680) (Date) (Close) vs Cboe U.S. Equities Historical Market Volume Data 2009 (Tape B Trade Count)
- Pearson correlation (r)
- -0.8154
- Spearman correlation
- -0.8293
- p-value
- 0
- Sample size (n)
- 252
- 95% confidence interval
- -0.853 to -0.7693
- Granger causality
- Bidirectional
- Granger optimal lag
- 10
AI analysis
Analysis: S&P 500 Close Price vs. Cboe Tape B Trade Count (2009)
Relationship Overview
The scatterplot reveals a clear negative relationship between the S&P 500 daily closing price and Cboe Tape B trade count throughout 2009. As the S&P 500 close price increases (moving right along the x-axis), the Tape B trade count tends to decrease, forming a downward-sloping cloud of points. This pattern makes intuitive sense within the 2009 market context: early in the year, equity prices were near their crisis lows while trading activity — particularly in smaller, more volatile securities captured by Tape B — was elevated due to panic selling, forced liquidations, and high-frequency activity during peak volatility. As markets recovered through the year, prices rose while frantic trading activity subsided. The linear regression equation (y = −0.000755x + 1251.61) quantifies this inverse relationship, indicating that for every 100,000-point increase in the S&P 500 close, Tape B trade count decreases by approximately 75.5 units.
Correlation Strength and Statistical Significance
The correlation of r = −0.8154 represents a strong negative linear association, and the R² of 0.6648 means that approximately 66.5% of the variance in Tape B trade count is explained by the S&P 500 closing price alone — a substantial explanatory share for financial market data with its inherent noise. The 95% confidence interval of [−0.853, −0.769] is relatively tight and entirely negative, providing strong evidence that the true population correlation is meaningfully negative and not a sampling artifact. The p-value of effectively zero, combined with a sample of n = 252 paired observations drawn from a population of N = 3,232, confirms this relationship is highly statistically significant. The bidirectional Granger causality (X→Y: F = 2.22, p = 0.018; Y→X: F = 2.26, p = 0.015) at an optimal lag of 10 trading periods is particularly notable: neither variable simply "leads" the other in a clean causal chain. Instead, past S&P 500 prices have modest predictive power over future Tape B trade counts, and past trade counts have modest predictive power over future S&P 500 prices, suggesting a feedback loop rather than a one-directional driver.
Notable Patterns, Clusters, and Outliers
Several structural features stand out beyond the central trend. At the lower end of the x-axis (S&P 500 close values roughly below 700–750, corresponding to the March 2009 market trough), trade counts reach their highest values (approaching 1,100–1,127), and the data points are somewhat more dispersed vertically, suggesting that volatility in trading activity was especially elevated at market lows. Conversely, at higher price levels (above 600,000 on the x-axis, representing later 2009 recovery prices), points cluster more tightly with lower trade counts, indicating more orderly markets. A handful of apparent outliers are visible — particularly points in the upper-left quadrant with high trade counts despite moderate price levels, and a few points in the lower-right with lower-than-expected trade counts at high prices. The point near (81,703, 1,126) stands out as an extreme low-price, high-trade-count observation consistent with early January or the March bottom. The distribution is not perfectly linear; there is a mild suggestion of concavity (the decline in trade count may steepen at lower price levels), hinting that a logarithmic or power-law fit might capture the relationship slightly better.
Confounding Factors and Interpretive Caveats
Several important caveats temper straightforward interpretation. Time is the hidden variable: both series are driven by calendar progression through 2009, meaning the correlation partly reflects a shared temporal trend (markets rising, panic subsiding) rather than a direct mechanistic link between price level and trade count. This is a classic spurious correlation via common trend, and the bidirectional Granger result may partly reflect both variables responding to the same underlying recovery narrative. Tape B specifically captures NYSE American (AMEX) and regional exchange securities — smaller-cap, more speculative names that attracted disproportionate activity during the crisis and whose trading dynamics differ from the broad S&P 500 constituents. Additionally, structural market changes in 2009 — evolving HFT activity, regulatory shifts, and the introduction of new trading venues — could independently affect trade counts in ways unrelated to price levels. The aggregation to daily frequency also smooths intraday dynamics that may tell a different story.
Actionable Insights and Further Investigation
Practitioners and researchers should consider several follow-up analyses. First, detrending both series (e.g., using first differences or residuals from a time trend) before computing correlations would isolate whether the price-volume relationship holds beyond the shared 2009 recovery trend. Second, given the bidirectional Granger causality at a 10-day lag, a trading strategy or risk model incorporating lagged Tape B trade counts as a signal for near-term S&P 500 direction (and vice versa) warrants backtesting — though the modest F-statistics suggest limited practical predictive power. Third, segmenting the data into pre- and post-March 9, 2009 (the market bottom) would test whether the relationship holds symmetrically in crash versus recovery phases. Finally, comparing Tape B with Tape A (NYSE) and Tape C (Nasdaq) trade counts would reveal whether this inverse relationship is specific to smaller-cap exchanges or a broad market phenomenon, potentially informing liquidity and volatility regime models.
X dataset: Cboe U.S. Equities Historical Market Volume Data 2009
Y dataset: S&P 500 Daily Time Series since 1927 (GitHub fja05680) (Date)
Part of experiment: Daily - Cboe U.S. Equities Historical Market Volume Data 2009 vs S&P 500 Daily Time Series since 1927 (GitHub fja05680) (Date)