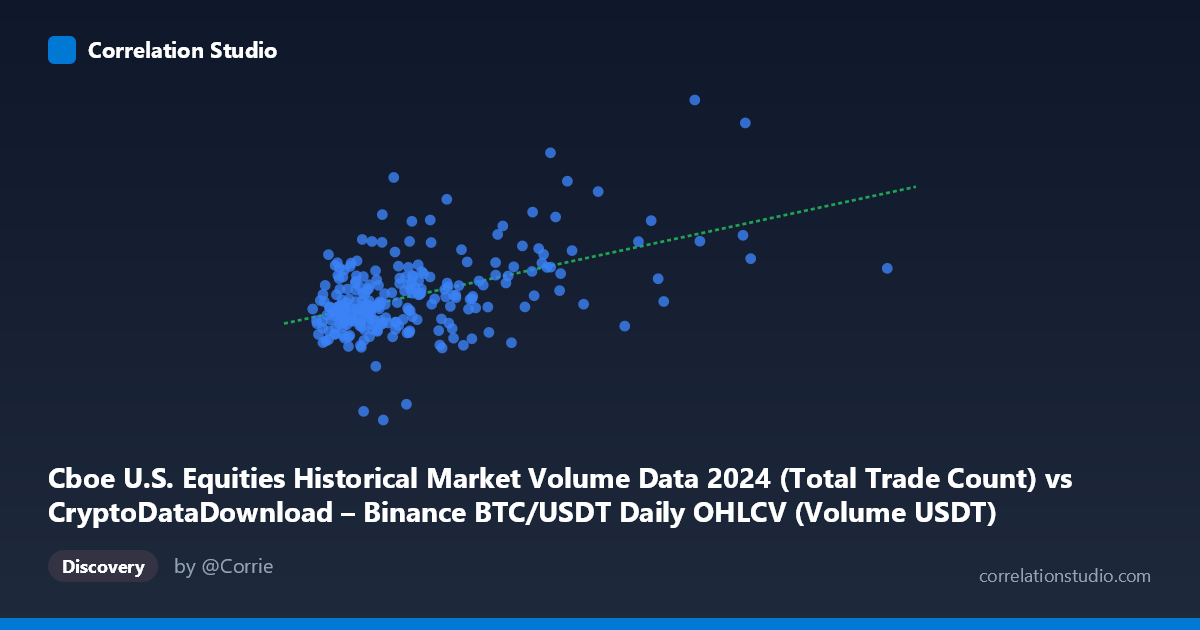
Cboe U.S. Equities Historical Market Volume Data 2024 (Total Trade Count) vs CryptoDataDownload – Binance BTC/USDT Daily OHLCV (Volume USDT)
- Pearson correlation (r)
- 0.4935
- Spearman correlation
- 0.3969
- p-value
- 0
- Sample size (n)
- 252
- 95% confidence interval
- 0.394 to 0.5816
- Granger causality
- None
- Granger optimal lag
- 10
AI analysis
Analysis: Cboe Equities Trade Count vs. Binance BTC/USDT Volume
1. Relationship Overview
The scatterplot shows a positive but noisy relationship between daily Cboe U.S. equities trade counts (X) and Binance BTC/USDT notional volume (Y). Most observations cluster tightly in the lower-left region (X between ~1.2B and ~3.5B trades, Y between ~3.4M and ~4.5M), while a handful of high-X outliers (5.3B–11B trades) pull the regression line's slope upward. The bulk of the data suggests a weak, noisy uptrend rather than a clean linear relationship.
2. Strength, Direction, and Statistical Uncertainty
The correlation coefficient (r = 0.494) indicates a moderate positive relationship, but r² = 0.244 means only about 24% of the variance in BTC trading volume is explained by equity trade counts — leaving roughly 76% driven by other factors. The 95% CI [0.394, 0.582] is reasonably tight given n=252, and the p-value (effectively 0) confirms this correlation is statistically significant and not due to chance. However, statistical significance with modest r² tells us the relationship is real but not practically strong enough for precise prediction.
Critically, the Granger causality tests show no significant predictive direction in either direction (X→Y: p=0.83; Y→X: p=0.96) at the tested lag structure (optimal lag=10). This means neither series reliably leads the other in time — the contemporaneous correlation is not being driven by one market anticipating or reacting to the other with a consistent time lag. This is an important distinction: correlation without Granger causality suggests both series may be responding to a shared underlying driver (e.g., overall macro risk sentiment, day-of-week trading patterns, or holiday effects) rather than one market mechanically influencing the other.
3. Patterns, Clusters, and Outliers
The data shows a dense, roughly elliptical cluster for typical trading days, with limited variance in Y for a given X range — consistent with the low r². A few notable outliers exist: points around X≈8.58B and X≈11.05B (implied by data range) with correspondingly elevated Y values, suggesting days of unusually high activity in both markets simultaneously — possibly major market events, macro news, or year-end volatility (e.g., December triple-witching, Fed announcements). There's also a low-Y outlier (Y=2.39M) at moderate X, indicating at least one day where equities activity was high but BTC volume was unusually subdued — worth flagging as a potential data anomaly or a genuinely divergent trading day.
4. Confounding Factors and Caveats
Several caveats limit causal interpretation: - Scale mismatch: Comparing "trade count" (a discrete count metric) to "USDT notional volume" (a dollar-value metric) conflates different units of market activity; a normalization (e.g., trade count vs. BTC trade count, or dollar volume vs. dollar volume) would be more apples-to-apples. - Shared macro drivers: Both crypto and equity markets are influenced by common factors — Fed policy, risk-on/risk-off sentiment, holidays/weekends (crypto trades 24/7, equities don't), and macroeconomic news — which could produce spurious correlation without any direct causal link. - Non-stationarity: Both series may trend over the year (e.g., BTC volume growth, equity trade count seasonality), and trending series often show inflated correlation unless detrended. - Outlier leverage: The handful of high-X points (5B trades) have outsized influence on the regression slope; excluding them could substantially change r and the fitted line.
5. Suggestions for Further Investigation
1. Detrend and difference the series before correlating, to rule out spurious correlation from shared trends/seasonality. 2. Test contemporaneous correlation of returns/changes rather than levels, which is more standard in cross-market financial analysis. 3. Investigate outlier dates (the 8.58B/11B X-range days and the 2.39M Y anomaly) for identifiable macro events. 4. Segment by day-of-week (weekday vs. weekend), since equities are closed on weekends while BTC trades continuously — this alone could be inflating or masking relationship strength. 5. Consider alternative comparison metrics (e.g., equities dollar volume vs. BTC dollar volume) for unit consistency, and rerun Granger tests at shorter lags (1–3 days) given daily data, since lag=10 may be too long to capture same-day/next-day spillover effects.
X dataset: CryptoDataDownload – Binance BTC/USDT Daily OHLCV
Y dataset: Cboe U.S. Equities Historical Market Volume Data 2024
Part of experiment: Bitcoin - CryptoDataDownload – Binance BTC/USDT Daily OHLCV vs Cboe U.S. Equities Historical Market Volume Data 2024