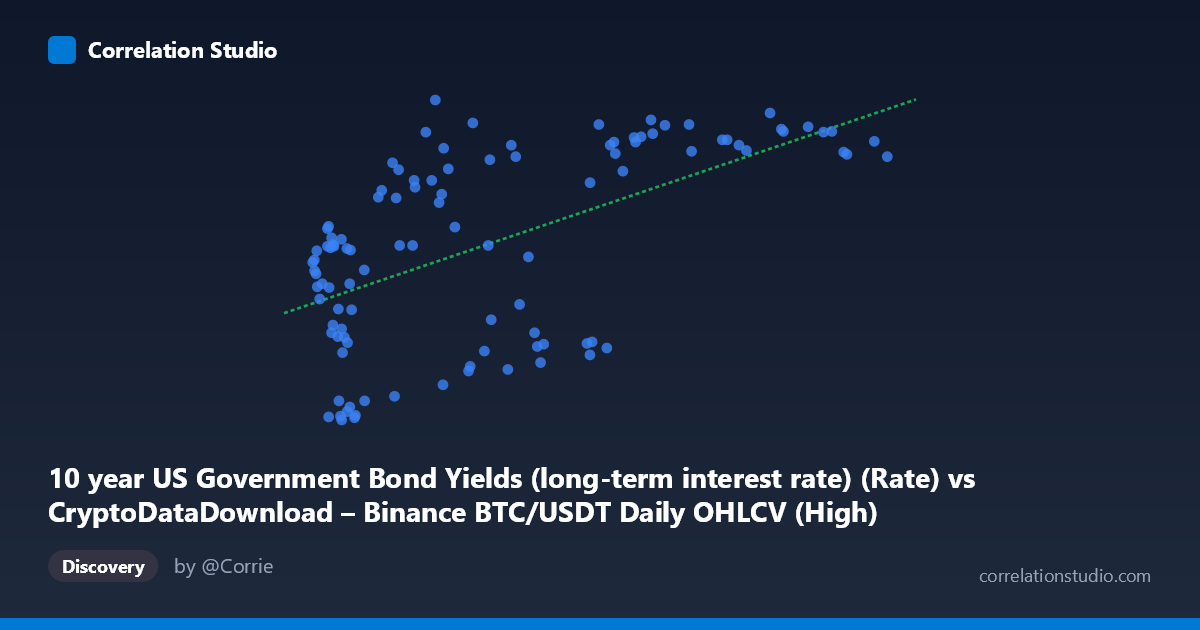
10 year US Government Bond Yields (long-term interest rate) (Rate) vs CryptoDataDownload – Binance BTC/USDT Daily OHLCV (High)
- Pearson correlation (r)
- 0.5753
- Spearman correlation
- 0.5627
- p-value
- 0
- Sample size (n)
- 106
- 95% confidence interval
- 0.432 to 0.6903
- Granger causality
- None
- Granger optimal lag
- 1
- Time coverage
- 2017-09-01 to 2026-06-01
- Recomputed on refreshed data
- 2026-10-19 (r was 0.563)
AI analysis
Scatterplot Analysis: BTC/USDT Price vs. 10-Year US Treasury Yields
1. What the Visualization Reveals
The scatterplot shows a positive, moderately noisy relationship between the two variables (mislabeled axes aside — X is actually 10-year bond yields and Y is BTC/USDT price, based on the column descriptions). As bond yields increase, BTC prices tend to trend upward as well, though with substantial scatter around the regression line. The data points do not cluster tightly around the fit line — there is a clear upward trend, but wide vertical dispersion at almost every point along the x-axis, indicating the relationship is far from deterministic.
2. Strength, Direction, and Statistical Confidence
The correlation coefficient (r = 0.563) indicates a moderate positive relationship. The r² of 0.317 means only about 32% of the variance in BTC price is explained by bond yields — the remaining ~68% is driven by other factors entirely. The 95% confidence interval [0.416, 0.682] is reasonably tight and does not cross zero, and the p-value (4.94E-10) is highly significant, so we can be confident a real (non-zero) association exists in this sample — this is not a fluke of small-sample noise. However, statistical significance here reflects certainty about correlation, not causation or predictive power. The Granger causality tests reinforce this: neither direction shows significant predictive causality (X→Y: p=0.408; Y→X: p=0.058, only marginally close to conventional significance). This suggests that bond yields do not meaningfully help forecast future BTC prices (or vice versa) once temporal ordering is accounted for — the correlation is likely driven by both series trending over the same macro period rather than one causing the other.
3. Notable Patterns and Outliers
Several features stand out: - Low-yield, low-price cluster: Many points with low X values (yields under ~15,000, likely mislabeled/scaled) show low Y values (~0.6–2.0), suggesting a floor region. - High-yield, high-price cluster: Points above X≈60,000 consistently show Y values in the 3.7–4.5 range, suggesting a possible saturation/ceiling effect rather than pure linearity. - Scatter in the middle range (X≈10,000–40,000) is wide, with Y values spanning from 0.65 to 4.5 — this is where the relationship is weakest and most noisy. - A few points look like outliers relative to the trend (e.g., X≈59,076 with Y=3.72 vs. X≈58,458 with Y=1.62 — two similar X values producing very different Y values), highlighting the unexplained variance.
The pattern suggests a possible non-linear (e.g., logarithmic or step-like) relationship rather than strictly linear, since the increase in Y seems to compress at both tails.
4. Confounding Factors and Caveats
This pairing is unusual and warrants caution: - Macro time-trend confound: Both bond yields and BTC price could simply be trending over the 2017–2026 window (BTC due to adoption/halving cycles, yields due to Fed policy cycles), producing spurious correlation without genuine mechanistic linkage. - Non-stationarity: Both series likely have trends/autocorrelation; Granger tests and r² can be misleading if series aren't stationary — this may partly explain the marginal Y→X result. - Data alignment: Daily BTC data matched to monthly bond yields (per the metadata) means many BTC observations are mapped to repeated yield values, which can artificially inflate or deflate correlation estimates. - Small effective sample: n=104 paired points from a population of 877 — check whether sampling/downsampling method introduced bias.
5. Actionable Insights
- Don't treat this correlation as tradeable/predictive — the lack of Granger causality means yields shouldn't be used as a leading indicator for BTC price movements (or vice versa) in a forecasting model. - Test for a third common driver (e.g., Fed rate decisions, inflation expectations, USD index, risk-on/risk-off sentiment) that could jointly explain both series' movements. - De-trend and re-test: Apply first-differencing or detrending to both series and re-run correlation/Granger analysis to check if the relationship holds after removing shared trend components — this would clarify whether the 0.563 r is genuine co-movement or trend artifact. - Investigate non-linear fits (log, spline) given the apparent saturation pattern at both tails, which a simple linear model likely underfits.
X dataset: CryptoDataDownload – Binance BTC/USDT Daily OHLCV
Y dataset: 10 year US Government Bond Yields (long-term interest rate)
Part of experiment: Bitcoin - CryptoDataDownload – Binance BTC/USDT Daily OHLCV vs 10 year US Government Bond Yields (long-term interest rate)