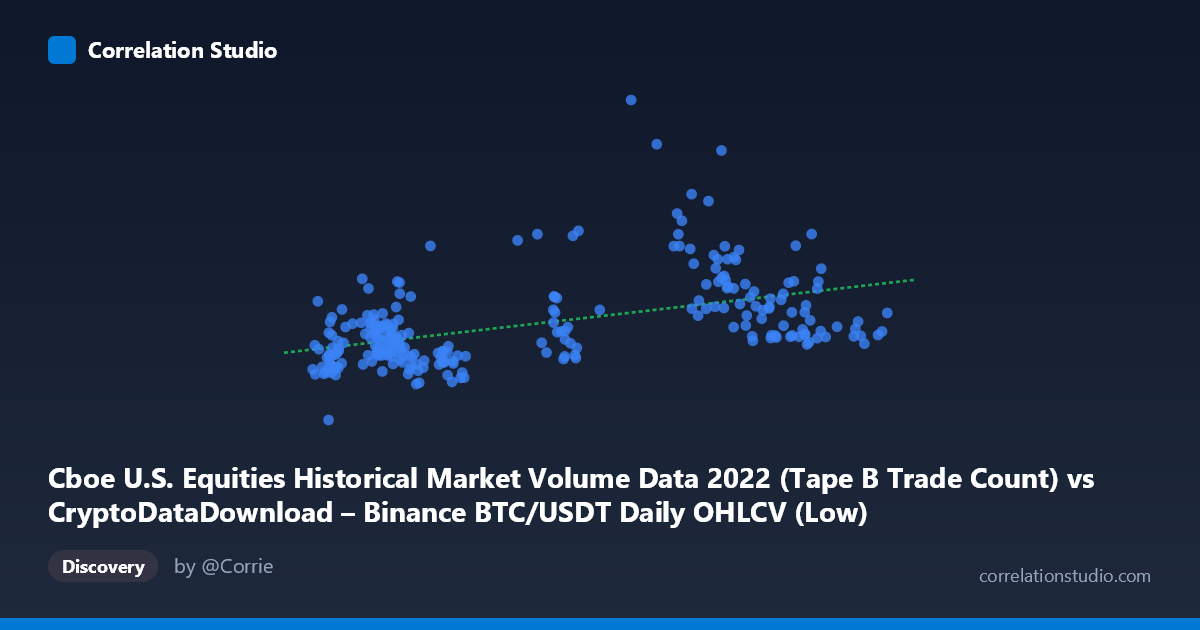
Cboe U.S. Equities Historical Market Volume Data 2022 (Tape B Trade Count) vs CryptoDataDownload – Binance BTC/USDT Daily OHLCV (Low)
- Pearson correlation (r)
- 0.4819
- Spearman correlation
- 0.4801
- p-value
- 0
- Sample size (n)
- 251
- 95% confidence interval
- 0.3808 to 0.5716
- Granger causality
- None
- Granger optimal lag
- 10
AI analysis
Analysis: Cboe Equities Trade Count vs. BTC/USDT Daily Low
1. What the Visualization Reveals
The scatterplot shows a moderate positive association between Cboe U.S. equities trade count (Tape B) and the daily low price of BTC/USDT on Binance. As trade counts increase from roughly 15,000 to 47,000, the BTC low prices show a general upward drift, but with substantial scatter. The relationship is far from a tight linear band — there's considerable vertical spread at every X value, particularly in the mid-to-upper X range (30,000–41,000), where Y values fan out dramatically from ~450,000 to over 1,200,000.
2. Strength, Direction, and Statistical Confidence
The correlation coefficient (r = 0.482) indicates a moderate positive relationship, with r² = 0.232 meaning only about 23% of the variance in BTC lows is explained by equity trade counts — leaving roughly 77% attributable to other factors. The 95% CI [0.381, 0.572] is reasonably tight and excludes zero, and the p-value (4.44×10⁻¹⁶) confirms this correlation is highly statistically significant and not due to chance, despite the modest effect size. However, statistical significance here reflects sample size/consistency rather than practical predictive power.
Critically, the Granger causality tests show no significant predictive direction in either direction (X→Y: p=0.378; Y→X: p=0.543) at the optimal 10-period lag. This means neither series reliably helps forecast the other over time — the contemporaneous correlation does not imply one variable leads or drives the other. This is an important caveat: a moderate r² paired with no Granger causality suggests the co-movement may stem from shared external drivers (e.g., macro risk sentiment) rather than a direct causal or lead-lag mechanism between equity volume and crypto prices.
3. Notable Patterns and Outliers
Several data points stand out sharply: (37867.65, 1,212,395), (35440.45, 968,367), (35701.00, 940,444), (27785.00, 888,427), and (26700.00, 864,555) — these represent BTC lows far above the general trend line, creating a cluster of high-leverage outliers in the mid-X range. This suggests episodes where BTC prices were elevated independent of equity trading volume — likely reflecting distinct volatility regimes or time periods (e.g., BTC's early-2022 highs before its subsequent decline through the year). The bulk of points cluster in two loose bands: lower-X (15,000–23,000) with Y mostly under 550,000, and higher-X (35,000–46,000) with more dispersion, including the extreme outliers.
4. Confounding Factors and Caveats
Both series are time-ordered daily data from 2022, a year of significant macro stress (Fed rate hikes, crypto contagion events like Terra/LUNA and FTX). Both equity trading volume and BTC prices could be jointly influenced by broad market volatility, risk-off sentiment, and liquidity conditions, producing spurious correlation without direct causation. Additionally, BTC prices in 2022 exhibited a strong secular downtrend (from ~$47K to ~$16K), while equity trade counts may have their own trend/seasonality — shared trends in non-stationary time series can inflate correlation estimates. The lack of Granger causality supports treating this as a coincidental trend alignment rather than a functional relationship.
5. Suggestions for Further Investigation
- Detrend or difference both series (e.g., use daily returns instead of levels) to check if the correlation persists after removing shared downward trends — this is critical given both series appear non-stationary. - Segment by market regime (pre/post major crypto events like LUNA collapse in May or FTX collapse in November) to see if the correlation is driven by specific crisis windows rather than a stable year-round relationship. - Introduce a third variable such as VIX, Fed policy dates, or overall crypto market cap to test whether both series are proxying for a common risk-sentiment factor. - Given the weak r² and null Granger result, this relationship should not be used for predictive trading models linking equity trade activity to BTC price levels without further validation on returns/volatility rather than raw levels.
X dataset: CryptoDataDownload – Binance BTC/USDT Daily OHLCV
Y dataset: Cboe U.S. Equities Historical Market Volume Data 2022
Part of experiment: Bitcoin - CryptoDataDownload – Binance BTC/USDT Daily OHLCV vs Cboe U.S. Equities Historical Market Volume Data 2022