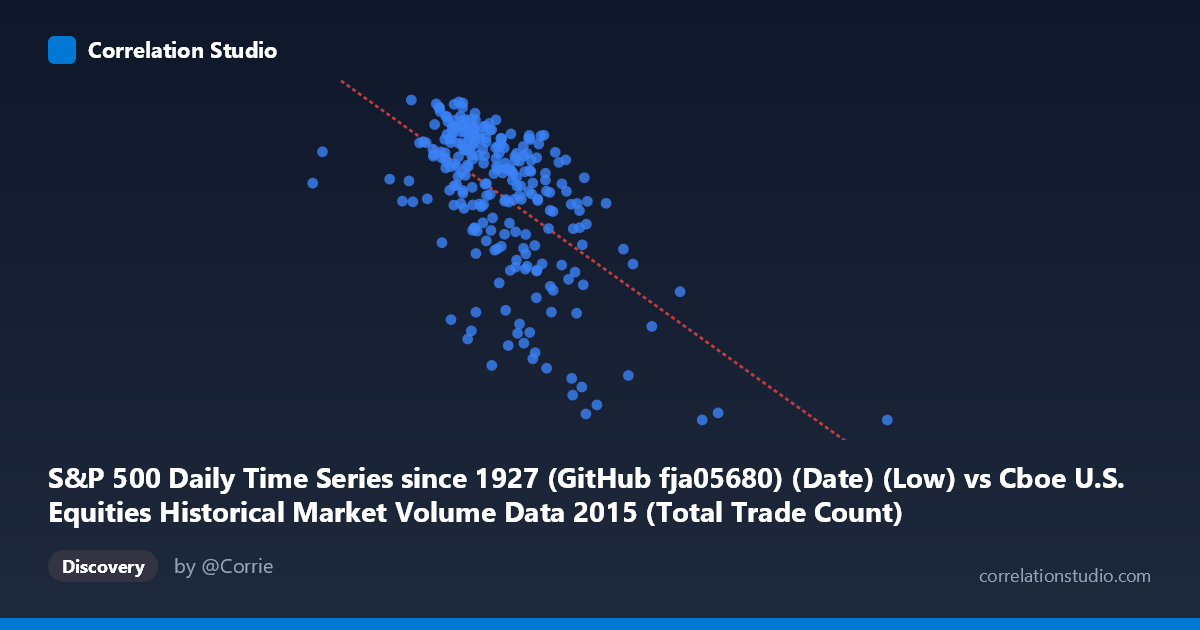
S&P 500 Daily Time Series since 1927 (GitHub fja05680) (Date) (Low) vs Cboe U.S. Equities Historical Market Volume Data 2015 (Total Trade Count)
- Pearson correlation (r)
- -0.5853
- Spearman correlation
- -0.5594
- p-value
- 0
- Sample size (n)
- 252
- 95% confidence interval
- -0.661 to -0.4977
- Granger causality
- None
- Granger optimal lag
- 1
AI analysis
Analysis: S&P 500 Daily Low vs. Total Trade Count (2015)
Relationship Overview The scatterplot reveals a negative relationship between the S&P 500 daily low price (X-axis) and the total trade count on U.S. equity exchanges (Y-axis). As the S&P 500's daily low increases — reflecting higher absolute price levels — the number of trades executed tends to decrease. This is visually apparent from the downward-sloping cluster of points, with higher trade counts concentrated at lower index price levels and trade counts tapering as prices rise. The linear regression equation (y = -7.30×10⁻⁵x + 2230.77) confirms this inverse slope, though the relationship is clearly not perfectly linear.
Correlation Strength and Statistical Significance The Pearson correlation of r = -0.5853 indicates a moderate negative association. More precisely, R² = 0.3425, meaning that roughly 34.3% of the variance in total trade count is explained by the S&P 500 daily low — a meaningful but far from complete explanation, leaving ~65.7% of variance attributable to other factors. The 95% confidence interval of [-0.6610, -0.4977] is entirely negative and reasonably tight, reinforcing that the negative direction is not a statistical artifact. The p-value of effectively zero confirms high statistical significance given n = 252 paired observations from a population of N = 3,302. However, the Granger causality tests tell a more cautious story: neither direction (X→Y: F = 0.040, p = 0.842; Y→X: F = 0.156, p = 0.693) achieves significance, meaning that neither variable temporally predicts the other at a 1-period lag. Correlation here is contemporaneous — not predictive — which substantially limits any causal interpretation.
Patterns, Clusters, and Outliers The data exhibits several notable structural features. The bulk of observations cluster in the X range of approximately 1,900,000–2,700,000, corresponding to trade counts between roughly 2,000 and 2,125 — a relatively dense core. However, there is a visible right-side tail extending toward X values of ~3,900,000–5,500,000, where trade counts drop to near or below 1,900, including the minimum of ~1,867. These high-price, low-trade-count points are influential in driving the negative correlation. Conversely, a notable outlier at (997,371, ~2,059) sits far to the left, representing an unusually low S&P 500 daily low — potentially corresponding to a single volatile session or data anomaly. Some vertical dispersion at similar X values (e.g., points near X ≈ 2,100,000–2,200,000 spanning Y from ~2,040 to ~2,124) suggests that price level alone leaves substantial unexplained variability in trade counts at any given price range.
Confounding Factors and Caveats Several important caveats apply. First, this correlation likely reflects shared temporal trends rather than a direct causal mechanism: throughout 2015, U.S. equity prices generally trended higher during calmer periods and fell during volatility spikes (notably the August 2015 correction), while trading volumes and trade counts tend to surge during high-volatility, lower-price episodes. Thus, both variables may be jointly driven by market volatility and risk-off episodes rather than by price level per se. Second, the datasets originate from different sources (Cboe market volume data and Yahoo Finance S&P 500 prices), and any alignment or lag in date matching could introduce noise. Third, structural market factors — such as algorithmic trading activity, options expiration dates, and macroeconomic announcements — independently influence trade counts without regard to price level. The dataset also covers only one calendar year (2015), limiting generalizability.
Actionable Insights and Further Investigation Given the moderate correlation and absence of Granger causality, practitioners should avoid using daily S&P 500 price levels as a standalone predictor of trade volume dynamics. More productive next steps would include: (1) incorporating volatility measures (e.g., VIX, realized volatility) as a potential mediating or confounding variable to test whether the price–volume relationship disappears once volatility is controlled; (2) decomposing trade counts by exchange or trade type to determine whether the pattern is driven by specific market microstructure factors; (3) extending the time window beyond 2015 to assess whether this relationship is stable across different market regimes; and (4) testing non-linear models (e.g., polynomial or regime-switching), given the visible heteroscedasticity in the scatter. The August 2015 volatility cluster in particular warrants isolation as a sub-period analysis to understand whether it disproportionately drives the observed correlation.
X dataset: Cboe U.S. Equities Historical Market Volume Data 2015
Y dataset: S&P 500 Daily Time Series since 1927 (GitHub fja05680) (Date)
Part of experiment: Daily - Cboe U.S. Equities Historical Market Volume Data 2015 vs S&P 500 Daily Time Series since 1927 (GitHub fja05680) (Date)