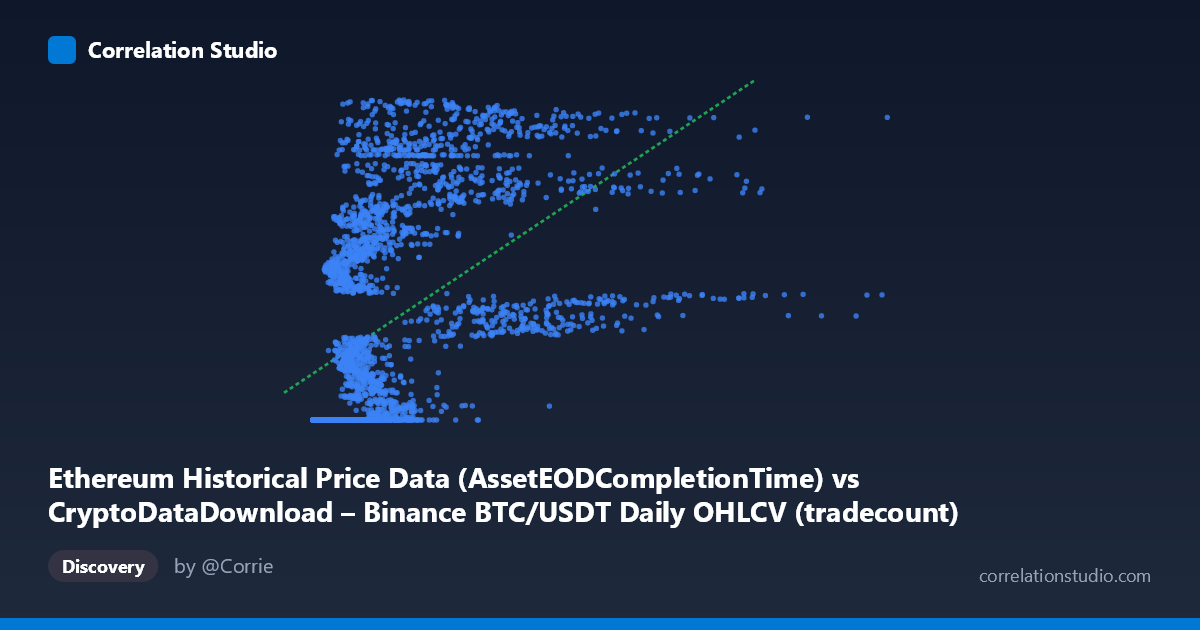
Ethereum Historical Price Data (AssetEODCompletionTime) vs CryptoDataDownload – Binance BTC/USDT Daily OHLCV (tradecount)
- Pearson correlation (r)
- 0.5262
- Spearman correlation
- 0.7892
- p-value
- 0
- Sample size (n)
- 3191
- 95% confidence interval
- 0.5007 to 0.5509
- Granger causality
- None
- Granger optimal lag
- 10
- Time coverage
- 2017-08-17 to 2026-05-20
AI analysis
Analysis: BTC/USDT Price vs. Ethereum Tradecount Relationship
1. What the Visualization Reveals
This scatterplot compares two variables that are actually mismatched in their labeling — the X-axis is described as Ethereum price data timestamps, but the values (2,153 to 15,364,010) are far too small to be BTC/USDT prices; they more plausibly represent a volume, index, or sequential/count metric. The Y-axis (tradecount, ~1.6–1.78 billion) is unusually large for a daily trade count as well, suggesting this may actually be a cumulative counter or a different scaled metric. Setting aside labeling ambiguity, the data show a clear pattern: at low X-values (roughly 0–1,000,000), Y clusters tightly near a floor of ~1,614,335,000–1,614,335,700, indicating many data points are "stuck" at a minimum value. As X increases beyond ~1,000,000, Y rises steeply and disperses across a much wider range (up to ~1.78 billion), producing a curved, non-linear relationship.
2. Strength, Direction, and Statistical Confidence
The Pearson correlation (r = 0.526, r² = 0.277) indicates a moderate positive relationship, but only 27.7% of the variance in Y is explained by X — meaning most of Y's variability (over 70%) is driven by other factors. The 95% confidence interval [0.501, 0.551] is tight and does not cross zero, and the p-value of ~0 confirms this correlation is highly statistically significant and not due to chance, largely a function of the large sample size (n=3,191). However, statistical significance here signals reliability of the correlation's existence, not its practical strength — r² of 0.28 is a weak-to-moderate effect size in practical terms. Critically, the Granger causality tests show no significant predictive direction in either direction (X→Y: p=0.446; Y→X: p=0.661) at 10 lags. This means neither series helps forecast the other's future values — the association is likely contemporaneous/structural (e.g., both driven by time or a shared external factor) rather than one causing or leading the other.
3. Notable Patterns and Non-linear Features
The most striking feature is the floor/threshold effect: a large cluster of points sits at a nearly constant Y-value (~1,614,335,xxx) across a wide range of low X-values, forming a horizontal band. This suggests these observations correspond to an early time period where Y was pinned at a minimum or baseline value (consistent with the "2017-08-17 start date" — possibly before certain network activity or data collection began). Beyond this floor, Y increases with X in a pattern that looks more logarithmic or saturating than linear, which aligns with the note that Spearman's ρ exceeds Pearson's r, confirming a monotonic but non-linear relationship. A linear fit (y = 12.8x + 1.638e9) understates the true association strength because it forces a straight line through a curved/threshold pattern. There also appear to be high-X outliers (e.g., X ≈ 15,364,010) that could disproportionately affect the linear slope.
4. Confounding Factors and Caveats
The most important caveat is that both variables are time series, and the metadata confirms this (each observation tied to a daily date from 2017–2026). Any correlation between two trending time series can be spurious — both may simply be trending upward over the multi-year sample period due to market growth, adoption, or exchange volume growth, without any direct mechanical link between them. The dataset description itself is confusing (mismatched column labels between BTC and ETH), so it's unclear whether we are truly comparing price to trade count, or two proxies for the same underlying growth trend (e.g., cumulative timestamps or index values). Additionally, the floor-clustering suggests data quality issues (padding, imputation, or a metric that didn't start being recorded until partway through the series) that could artificially inflate the apparent correlation.
5. Suggested Next Steps
1. Clarify data provenance — confirm what X and Y actually represent, given the labeling inconsistency, before drawing further conclusions. 2. Fit non-linear models (log, power, or piecewise/threshold regression) to better capture the true relationship, since Spearman ρ Pearson r signals non-linearity. 3. De-trend or difference the series (e.g., use daily % changes instead of levels) to test whether the correlation persists once shared time-trend is removed — this will reveal if the relationship is genuine or an artifact of co-trending. 4. Segment the analysis by excluding the "floor" period (early low-X points) to see if the relationship strengthens or changes in the more dynamic later regime. 5. Given the null Granger causality result, avoid using one series to forecast the other; instead, investigate a third common driver (e.g., overall market cap, adoption metrics, or calendar time) that may explain the shared movement.
X dataset: CryptoDataDownload – Binance BTC/USDT Daily OHLCV
Y dataset: Ethereum Historical Price Data
Part of experiment: Bitcoin - CryptoDataDownload – Binance BTC/USDT Daily OHLCV vs Ethereum Historical Price Data