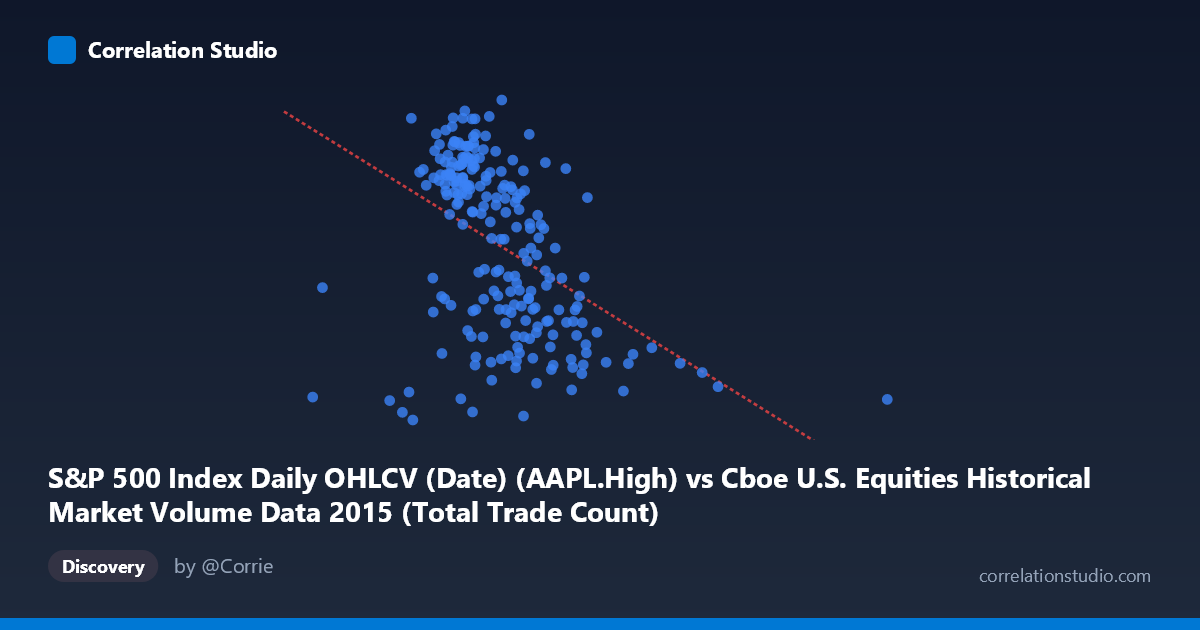
S&P 500 Index Daily OHLCV (Date) (AAPL.High) vs Cboe U.S. Equities Historical Market Volume Data 2015 (Total Trade Count)
- Pearson correlation (r)
- -0.4457
- Spearman correlation
- -0.5024
- p-value
- 0
- Sample size (n)
- 222
- 95% confidence interval
- -0.5454 to -0.3336
- Granger causality
- None
- Granger optimal lag
- 1
AI analysis
Scatterplot Analysis: AAPL High Price vs. Total Trade Count (2015)
Relationship Overview The scatterplot reveals a negative relationship between Apple's daily high price (X-axis) and the total U.S. equities trade count (Y-axis) across the 2015 trading year. As AAPL's high price increases, the total number of trades across U.S. equity markets tends to decrease modestly. The linear regression equation (y = -6.74×10⁻⁶x + 138.74) captures this downward slope, though the scatter around the regression line is substantial, suggesting the relationship is real but far from deterministic. Visually, the bulk of observations cluster in the AAPL high price range of roughly $2.0M–$3.0M (in the scaled units used), with trade counts spanning approximately 107 to 134, indicating considerable day-to-day variability in market activity even at similar price levels.
Correlation Strength and Statistical Significance The Pearson correlation of r = -0.4457 indicates a moderate negative association, but the explanatory power is limited: r² = 0.1987, meaning only about 19.9% of the variance in total trade count is explained by AAPL's high price. The remaining ~80% is attributable to other factors entirely outside this model. The 95% confidence interval of [-0.5454, -0.3336] is meaningfully below zero, confirming the negative direction with reasonable precision, and the p-value of 3.1×10⁻¹² is highly statistically significant given n = 222, ruling out chance as an explanation for the observed correlation. However, statistical significance here reflects the large sample size as much as effect size — the practical magnitude of this relationship is modest at best. Critically, the Granger causality tests show no significant predictive directionality in either direction (X→Y: F = 0.89, p = 0.35; Y→X: F = 0.10, p = 0.75), meaning neither variable reliably predicts future values of the other at a one-period lag. This firmly cautions against any causal or predictive interpretation despite the statistically significant correlation.
Notable Patterns, Clusters, and Outliers The data exhibits a tight central cluster between approximately $2.0M–$3.2M on the X-axis, where most of the 222 observations reside, consistent with AAPL's typical price range during mid-2015. Within this cluster, the negative trend is apparent but noisy, with trade counts varying widely (~108–134) even at nearly identical AAPL price levels. Several notable outliers stand out: one point at approximately x = 5,549,284 (far right, the maximum X value) with a trade count near 108.8 sits in extreme isolation, likely representing an anomalous or adjusted data point well beyond the normal distribution. Similarly, a point near x = 4,083,023 and another near x = 1,074,584 (far left) deviate substantially from the central mass, potentially representing data irregularities, stock splits, corporate actions, or data encoding artifacts. The lower-left region also shows a point at roughly (1,707,720, 107.69), which is the lowest trade count in the sample and may correspond to a low-volume holiday-adjacent session.
Confounding Factors and Interpretive Caveats A fundamental caveat here is that the axis labels appear inverted — the dataset notes indicate AAPL High is the X variable drawn from the Cboe market volume dataset, while Total Trade Count is the Y variable drawn from the S&P 500 OHLCV dataset. This cross-dataset pairing suggests the variables may have been matched by date index rather than any intrinsic theoretical relationship, making the correlation potentially spurious or driven by shared temporal trends rather than a meaningful economic mechanism. Both variables likely exhibit common time-series patterns during 2015 — AAPL's price declined notably in the August 2015 market correction while volatility and trade counts spiked — creating a mechanically negative correlation through a shared market stress event rather than a structural relationship. Seasonality, macroeconomic shocks (China slowdown fears, Fed rate expectations), and index rebalancing events all represent confounders that could inflate or distort the observed r value without reflecting any genuine link between AAPL's intraday high and aggregate market trading activity.
Actionable Insights and Further Investigation Given the modest explanatory power and absence of Granger causality, this correlation should not be used for predictive modeling in its current form. However, several investigative paths are worthwhile: (1) Segment the analysis by market regime — separating the calm pre-August period from the high-volatility August–September 2015 correction may reveal that the correlation is largely driven by that single stress episode, which would be an important structural finding. (2) Investigate the extreme outliers at x ≈ 5.55M and x ≈ 4.08M — these may reflect data normalization issues, stock split adjustments, or erroneous joins that, if corrected, could meaningfully shift the correlation. (3) Partial out shared market factors (VIX, S&P 500 returns, day-of-week effects) to test whether any residual correlation persists, which would more cleanly isolate any genuine AAPL-specific signal. (4) Consider longer time horizons and multiple years to determine whether the negative relationship is a stable structural feature or a 2015-specific artifact driven by AAPL's price trajectory during a turbulent year.
X dataset: Cboe U.S. Equities Historical Market Volume Data 2015
Y dataset: S&P 500 Index Daily OHLCV (Date)
Part of experiment: Daily - Cboe U.S. Equities Historical Market Volume Data 2015 vs S&P 500 Index Daily OHLCV (Date)