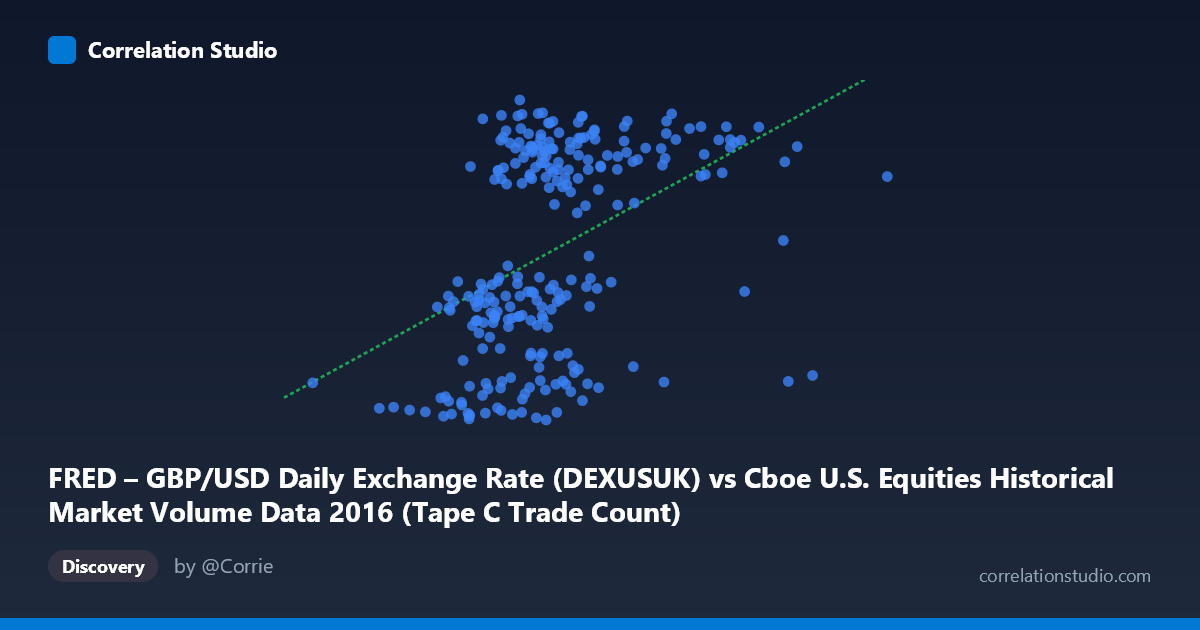
FRED – GBP/USD Daily Exchange Rate (DEXUSUK) vs Cboe U.S. Equities Historical Market Volume Data 2016 (Tape C Trade Count)
- Pearson correlation (r)
- 0.4288
- Spearman correlation
- 0.4677
- p-value
- 0
- Sample size (n)
- 250
- 95% confidence interval
- 0.3218 to 0.5249
- Granger causality
- None
- Granger optimal lag
- 1
AI analysis
Analysis: GBP/USD Exchange Rate vs. Cboe Tape C Trade Count (2016)
Relationship Overview The scatterplot reveals a modest positive association between Cboe U.S. equities market volume (Tape C trade count, on the X-axis) and the GBP/USD exchange rate (Y-axis) across 250 trading days in 2016. The linear regression equation (y = 2.49×10⁻⁷x + 1.178) confirms the positive slope, meaning that as equity trade counts increase, the pound sterling tends to trade at a slightly higher value against the dollar. However, the data points exhibit considerable scatter around the regression line, immediately signaling that this relationship is far from deterministic and that many other forces are at work in either variable.
Correlation Strength and Statistical Significance The Pearson correlation of r = 0.43 indicates a weak-to-moderate positive relationship. More meaningfully, r² = 0.184, meaning only 18.4% of the variance in GBP/USD is explained by Tape C trade count — leaving over 80% attributable to other factors entirely. The 95% confidence interval of [0.32, 0.52] is reassuringly narrow given the sample size of n = 250 drawn from N = 3,622 observations, and the p-value of 1.33×10⁻¹² confirms the correlation is highly unlikely to be a statistical artifact. That said, statistical significance here is largely a function of sample size; the practical magnitude remains modest. Critically, Granger causality tests find no significant predictive directionality in either direction (X→Y: F = 0.078, p = 0.780; Y→X: F = 0.171, p = 0.680), meaning neither variable meaningfully predicts the other at a one-period lag. The correlation, while real, does not reflect a temporally ordered, predictive relationship.
Notable Patterns, Clusters, and Outliers Several structural features are visible in the data. The bulk of trade count observations cluster between roughly 550,000 and 900,000, with GBP/USD values spanning the full observed range of 1.22–1.48 within that band — indicating high variability in exchange rates even at typical volume levels. At least two prominent outliers are visible on the far right of the X-axis (near 1,143,268 and 1,187,414 trade counts), both associated with relatively low GBP/USD values around 1.25. These high-volume, low-sterling days likely correspond to specific market events in 2016 — most plausibly the Brexit referendum aftermath (June 23–24, 2016), which simultaneously caused a historic GBP collapse and a surge in U.S. equity trading activity. The lower-left region also shows a concentration of low exchange rate values (~1.22–1.25) spread across moderate volume levels, consistent with the sustained post-Brexit pound weakness through late 2016.
Confounding Factors and Interpretive Caveats The apparent correlation almost certainly reflects shared sensitivity to common macro events rather than any direct causal mechanism between U.S. equity volume and GBP/USD pricing. The 2016 calendar year was dominated by two extraordinary political shocks — the Brexit vote and the U.S. presidential election — both of which independently drove elevated market volatility, higher trading volumes, and sharp currency movements simultaneously. This creates a classic spurious correlation via confounding: a third variable (macro uncertainty/political events) drives both series in correlated ways. Additionally, the axis labels appear swapped in the dataset descriptions (X is labeled as exchange rate in the dataset name but described as trade count in the axis metadata), which warrants verification before drawing firm conclusions. The single-lag Granger test may also be insufficient to capture delayed relationships across longer horizons.
Actionable Insights and Further Investigation Given the Brexit-driven outliers' outsized influence on the correlation, a recommended first step is to re-run the analysis excluding the June 2016 referendum window to isolate whether the relationship persists in calmer market regimes. Researchers should also test multiple Granger causality lags (e.g., 5–20 trading days) to check for slower-moving relationships, and consider incorporating VIX or implied volatility as an explicit control variable to isolate the shared-uncertainty channel. Decomposing Tape C volume by trade size versus count could also reveal whether institutional versus retail activity patterns differ in their exchange rate sensitivity. Finally, extending the analysis across multiple years would help determine whether 2016's correlation is a stable structural feature or an artifact of an exceptionally volatile political year.
X dataset: Cboe U.S. Equities Historical Market Volume Data 2016
Y dataset: FRED – GBP/USD Daily Exchange Rate
Part of experiment: Daily - Cboe U.S. Equities Historical Market Volume Data 2016 vs FRED – GBP/USD Daily Exchange Rate