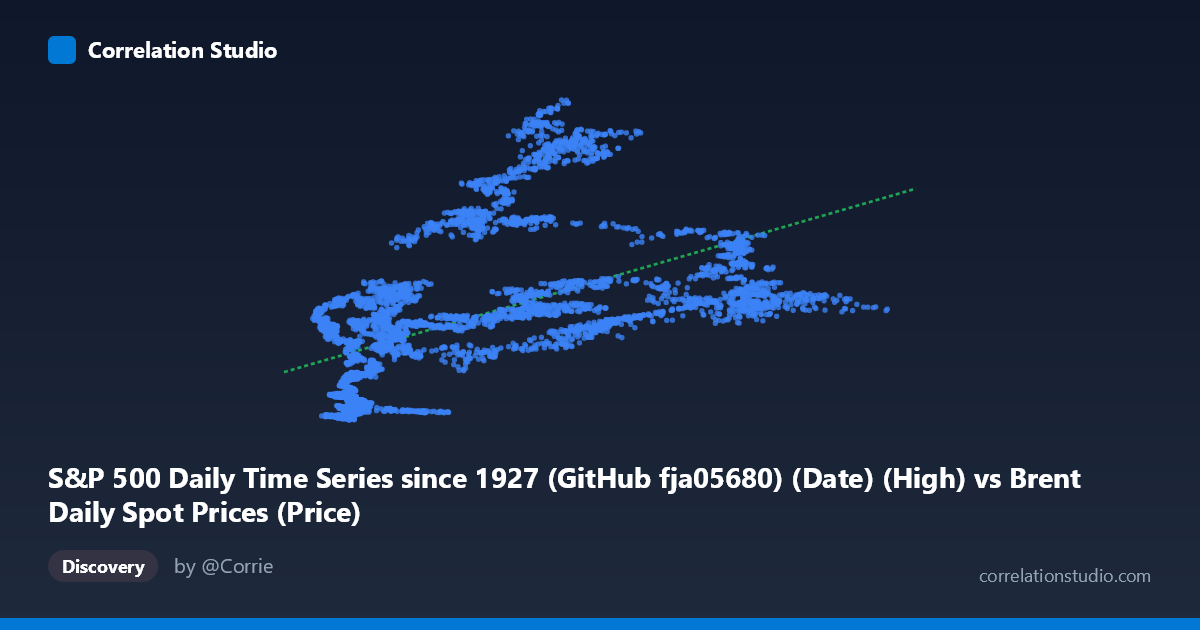
S&P 500 Daily Time Series since 1927 (GitHub fja05680) (Date) (High) vs Brent Daily Spot Prices (Price)
- Pearson correlation (r)
- 0.5381
- Spearman correlation
- 0.6914
- p-value
- 0
- Sample size (n)
- 8140
- 95% confidence interval
- 0.5225 to 0.5534
- Granger causality
- None
- Granger optimal lag
- 1
AI analysis
Analysis: Brent Crude Oil Prices vs. S&P 500 Index
1. Overall Relationship Visible in the Visualization
The scatterplot reveals a positive but highly dispersed relationship between Brent crude oil spot prices (X-axis) and S&P 500 daily highs (Y-axis). The linear regression line (y = 11.57x + 655.14) captures a general upward trend — as oil prices rise, S&P 500 values tend to be higher — but the scatter around this line is substantial. Data points span a wide envelope, with S&P 500 values ranging from roughly 235 to over 3,200 for overlapping ranges of oil prices, making individual predictions highly unreliable. The cloud of points suggests that while a broad directional association exists, the relationship is far from deterministic and likely reflects a shared secular trend (both series trending upward over the 1987–2019 period) rather than a tight functional coupling.
2. Correlation Strength, Direction, and Causality
The Pearson r of 0.538 indicates a moderate positive correlation, but the r² of 0.290 is the more sobering statistic: only about 29% of the variance in S&P 500 levels is explained by Brent crude prices, leaving 71% attributable to other factors entirely. With n = 8,140 paired observations and a p-value effectively at zero, the correlation is statistically unambiguous — this is not a sampling artifact. The 95% confidence interval [0.5225, 0.5534] is narrow, reflecting the large sample size and confirming the estimate is precise. However, statistical significance here is trivially easy to achieve at this sample size, and the practical magnitude of explained variance remains modest.
Critically, the Granger causality tests return no significant directional signal in either direction (X→Y: F = 0.907, p = 0.341; Y→X: F = 0.899, p = 0.343). Neither variable meaningfully predicts the other's next-period movement after accounting for its own history. This strongly undermines any narrative that oil prices "drive" equity markets or vice versa on a day-to-day temporal basis, at least at the lag-1 period tested. The correlation appears to be a level relationship, not a predictive one.
3. Notable Patterns, Clusters, and Non-Linear Features
Several structural features stand out in the data:
- Two loose clusters are apparent: a dense lower-left cluster (oil ~$10–$40, S&P ~235–1,200) representing the late 1980s through mid-1990s, and a more dispersed upper cluster (oil ~$40–$145, S&P ~800–3,200) representing the 2000s–2019 period. - Extreme vertical spread at mid-range oil prices (~$60–$80): S&P values at these oil levels range from ~940 to over 3,200, exemplified by sample points like (68.49, 942) versus (68.66, 3,226) — nearly a 3.5× difference in S&P level at essentially the same oil price. This alone signals severe heteroscedasticity. - The Spearman ρ exceeding Pearson r confirms a non-linear monotonic relationship, suggesting a logarithmic or polynomial fit would better capture the association than the linear model used. The relationship likely flattens or curves at higher oil price levels. - A few apparent outliers at high oil prices ($100/barrel) with relatively moderate S&P values may correspond to the 2008 oil price spike coinciding with the financial crisis equity collapse.
4. Confounding Factors and Interpretation Caveats
The most significant caveat is confounding by time. Both Brent crude and the S&P 500 are non-stationary time series with strong upward trends over the 1987–2019 period. Much or potentially most of the observed correlation may be spurious co-trending — two independent series rising together over three decades — rather than any genuine economic linkage. Without differencing or cointegration testing, the r = 0.54 figure is potentially misleading.
Additional confounders include: - Macroeconomic business cycles driving both equity valuations and commodity demand simultaneously - Dollar strength/weakness, which affects oil prices (denominated in USD) and can influence multinational S&P 500 earnings - Structural regime changes: the pre-2000 vs. post-2000 relationship between oil and equities is known to differ substantially in the literature - The axis label swap noted in the metadata (X-axis references "Date" from Brent dataset applied to S&P column, and vice versa) warrants verification that the data alignment is correct before drawing firm conclusions
5. Actionable Insights and Further Investigation
Given these findings, several analytical next steps would sharpen understanding:
1. Detrend both series (first differences or log-returns) before computing correlation — this would test whether day-to-day changes in oil prices correlate with changes in S&P levels, eliminating spurious trend correlation 2. Test for cointegration (Engle-Granger or Johansen) to determine if a genuine long-run equilibrium relationship exists beyond shared trending 3. Fit a logarithmic or polynomial regression given the Spearman Pearson signal; a log(X) model may substantially improve r² 4. Segment analysis by era (pre/post-2008 financial crisis; pre/post-shale revolution ~2014) to detect whether the relationship has structurally shifted — the heteroscedasticity visible in the plot strongly suggests regime-dependent behavior 5. Extend Granger testing to multiple lags (e.g., 5, 10, 22 trading days) to capture slower transmission mechanisms that might be missed at lag-1
The overall takeaway is that while a statistically robust positive correlation exists, its practical predictive value is limited, likely reflects shared secular trends more than causal linkage, and should not be used as a standalone trading or forecasting signal without substantially more rigorous time-series analysis.
X dataset: Brent Daily Spot Prices
Y dataset: S&P 500 Daily Time Series since 1927 (GitHub fja05680) (Date)
Part of experiment: Daily - Brent Daily Spot Prices vs S&P 500 Daily Time Series since 1927 (GitHub fja05680) (Date)