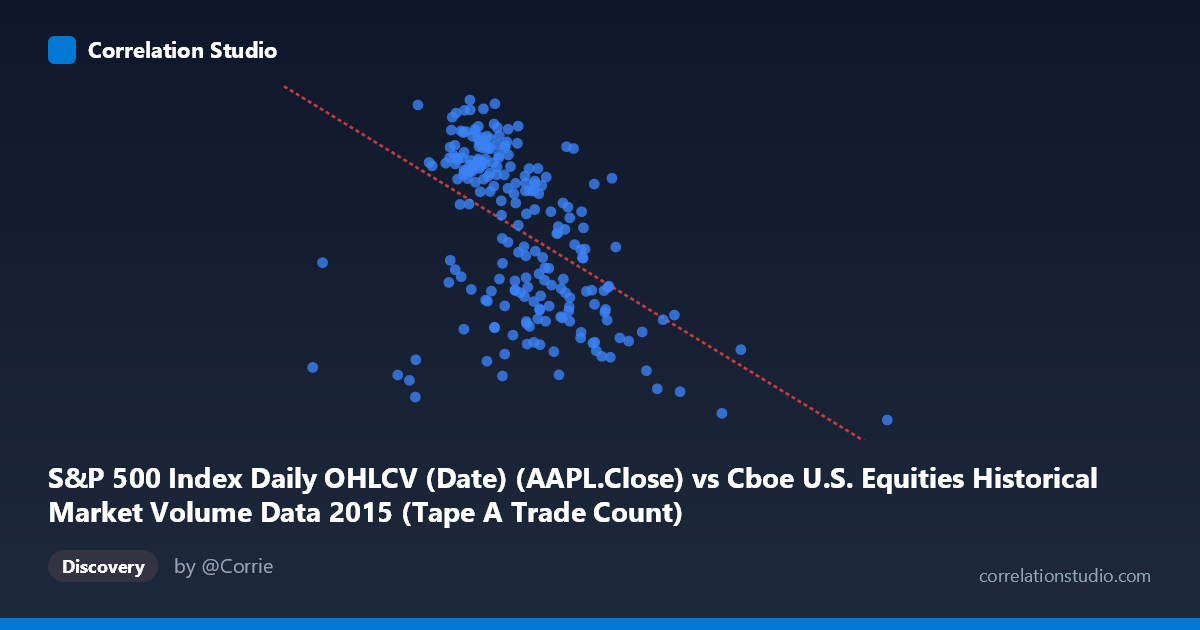
S&P 500 Index Daily OHLCV (Date) (AAPL.Close) vs Cboe U.S. Equities Historical Market Volume Data 2015 (Tape A Trade Count)
- Pearson correlation (r)
- -0.4889
- Spearman correlation
- -0.5392
- p-value
- 0
- Sample size (n)
- 222
- 95% confidence interval
- -0.583 to -0.3818
- Granger causality
- None
- Granger optimal lag
- 1
AI analysis
Analysis: AAPL Closing Price vs. Cboe Tape A Trade Count (2015)
Relationship Overview The scatterplot reveals a negative relationship between Apple's closing stock price (X-axis) and the Cboe U.S. Equities Tape A Trade Count (Y-axis) across the 2015 trading year. As AAPL's closing price increases, the number of Tape A trades tends to decrease, and conversely, lower AAPL prices correspond with higher trade counts. The linear regression equation (y = -1.40×10⁻⁵x + 140.69) confirms this downward slope. Visually, most data points cluster in the AAPL price range of roughly $1.1M–$1.75M (noting these are likely scaled or indexed values), with trade counts concentrated between approximately 110 and 133, though the relationship is far from tight.
Correlation Strength and Statistical Significance The Pearson correlation of r = -0.489 indicates a moderate negative association, but the explanatory power is notably limited: R² = 0.239, meaning only about 24% of the variance in Tape A trade counts is explained by AAPL's closing price. The remaining ~76% is attributable to other factors entirely. The 95% confidence interval of [-0.583, -0.382] is meaningfully negative throughout — it does not cross zero — and the p-value of 9.77×10⁻¹⁵ confirms this correlation is highly statistically significant, effectively ruling out chance as an explanation given n = 222 paired observations. However, statistical significance here reflects the robustness of detecting a relationship, not the practical magnitude of that relationship. The Granger causality results are unambiguous: neither direction (X→Y nor Y→X) reaches significance (F = 0.369, p = 0.544 and F = 0.060, p = 0.806, respectively), meaning AAPL closing prices do not temporally predict trade counts, nor vice versa. This is a critical caveat — the correlation reflects co-movement, not predictive causation.
Patterns, Clusters, and Outliers Several notable features stand out in the data. The bulk of observations form a loose, downward-sloping cloud centered around AAPL prices of ~$1.2M–$1.5M and trade counts of ~115–130. There are at least two prominent outliers at extreme X values: one point near x = 2,923,236 with y ≈ 103.12, and another near x = 2,247,816 with y ≈ 103.74. These high-X, low-Y outliers are substantially isolated from the main cluster and likely exert disproportionate leverage on the regression slope, potentially inflating the apparent strength of the negative correlation. On the low-X end, a point near x = 616,505 with y ≈ 117.81 also appears isolated. Within the main cluster, there is considerable vertical spread (trade counts ranging from ~106 to ~133 at similar price levels), reinforcing that price explains only a fraction of trade count variability.
Confounding Factors and Caveats Several important interpretive caveats apply. First, both variables are time-indexed to 2015, meaning any shared temporal trend (e.g., overall market decline in mid-2015 coinciding with volatility-driven volume surges) could produce a spurious correlation — this is a classic common-cause confound driven by macro market dynamics rather than a direct AAPL-to-volume mechanism. Second, the extreme outliers at high X values (potentially corresponding to specific market stress events or data anomalies) may be distorting the correlation significantly; removing them could substantially weaken r. Third, the axis labeling suggests a dataset join or metadata mismatch — Tape A Trade Count appears in the S&P 500 dataset column and AAPL Close in the Cboe dataset, which may indicate a cross-dataset merge where alignment errors or survivorship effects could introduce noise. Finally, Tape A covers NYSE-listed securities broadly, so using AAPL price as a proxy for overall market conditions is a substantial simplification.
Actionable Insights and Further Investigation Given the moderate but incomplete correlation and the absence of Granger causality, practitioners should avoid using AAPL price as a predictive signal for Tape A trade volume. The relationship is better interpreted as a symptom of shared market regime dynamics in 2015. Recommended next steps include: (1) re-running the analysis with the two high-leverage outliers removed to assess their specific impact on r and R²; (2) introducing a time-series decomposition to separate trend, seasonality, and residuals before correlating — this would clarify whether the relationship persists after removing shared temporal drift; (3) testing additional equity indices (e.g., broader S&P 500 level) against Tape A volume to determine whether AAPL specifically or market-wide price levels drive the pattern; and (4) examining volatility (VIX) or market stress indicators as potential mediating variables, since high-volatility periods in 2015 (particularly August) would naturally suppress prices while elevating trade counts simultaneously.
X dataset: Cboe U.S. Equities Historical Market Volume Data 2015
Y dataset: S&P 500 Index Daily OHLCV (Date)
Part of experiment: Daily - Cboe U.S. Equities Historical Market Volume Data 2015 vs S&P 500 Index Daily OHLCV (Date)