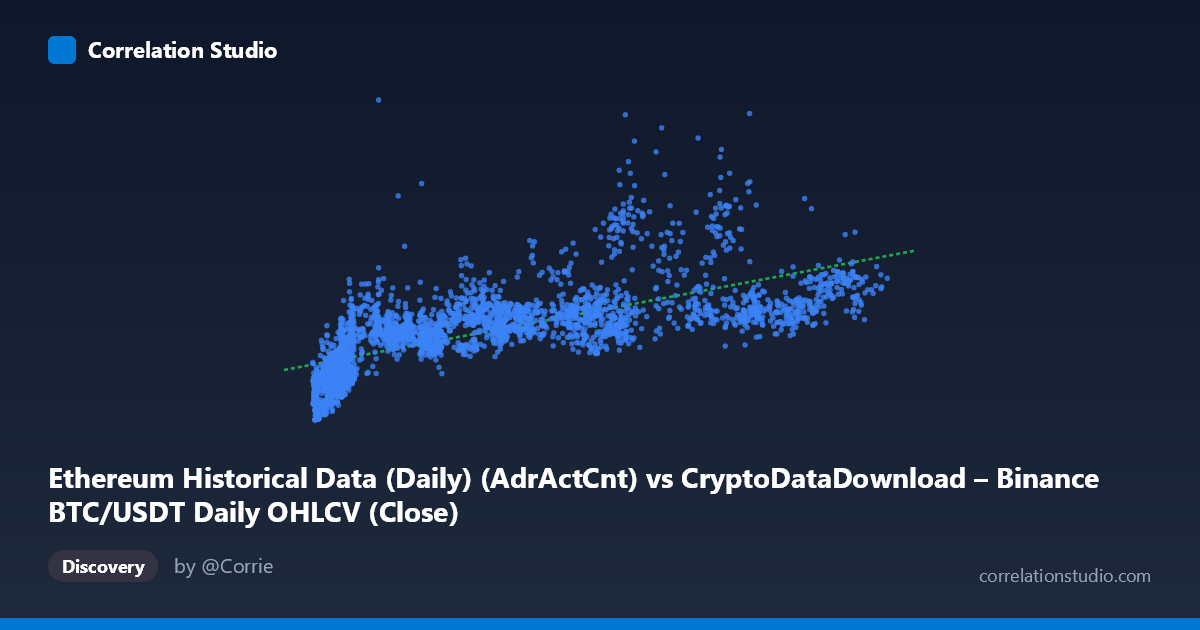
Ethereum Historical Data (Daily) (AdrActCnt) vs CryptoDataDownload – Binance BTC/USDT Daily OHLCV (Close)
- Pearson correlation (r)
- 0.6952
- Spearman correlation
- 0.8286
- p-value
- 0
- Sample size (n)
- 3191
- 95% confidence interval
- 0.6768 to 0.7127
- Granger causality
- None
- Granger optimal lag
- 10
- Time coverage
- 2017-08-17 to 2026-05-20
AI analysis
Analysis: Ethereum Active Address Count vs. Bitcoin Closing Price
1. What the Visualization Reveals
The scatterplot shows a positive, moderately strong relationship between Ethereum's daily active address count (X) and Bitcoin's closing price (Y). As active Ethereum addresses increase, Bitcoin's price tends to rise as well, though the relationship is far from deterministic — there is substantial scatter around the trend line, particularly at lower X values where Y ranges widely (e.g., addresses near 4,000-10,000 correspond to BTC prices anywhere from ~150,000 to ~615,000). The relationship appears to flatten or show more variance in the mid-range, hinting that a simple straight line may not be the ideal descriptor of the pattern.
2. Strength, Direction, and Uncertainty
The Pearson correlation of r = 0.695 indicates a moderately strong positive linear relationship, with r² = 0.483 meaning that only about 48% of the variance in Bitcoin price is statistically explained by Ethereum address activity — leaving over half unexplained by this single variable. The 95% confidence interval [0.677, 0.713] is tight, and with p ≈ 0, this correlation is highly statistically reliable given the large sample (n = 3,191) — we can be confident the true population correlation is meaningfully positive, not due to chance. However, statistical significance should not be conflated with practical predictive power: r² of 0.48 leaves considerable room for other drivers. Critically, the Granger causality tests show no significant predictive direction in either direction (X→Y: p=0.72; Y→X: p=0.67) even at an optimal lag of 10 periods. This strongly suggests the correlation reflects a shared underlying driver (likely overall crypto market cycles, sentiment, or liquidity conditions) rather than one variable temporally leading or causing changes in the other.
3. Notable Patterns and Outliers
Several structural features stand out: - Fan-shaped dispersion: variance in Y increases with X, suggesting heteroscedasticity — a hallmark that a log or power-law transformation of X (or both variables) may better capture the relationship. - Low-X cluster with high variance: many points cluster at X < 15,000 but span Y from ~150K to ~615K, indicating that in periods of low ETH network activity, BTC price behavior is highly variable (likely reflecting different market regimes/years within the data). - High-X, high-Y points: values like (66,902 / 999,185) and (81,447 / 936,565) suggest a cluster of simultaneous "bull market" periods where both metrics surge together, potentially driving much of the observed correlation. - The note that Spearman ρ exceeds Pearson r confirms a monotonic but non-linear relationship — a logarithmic or power transform of X should be tested to improve fit.
4. Confounding Factors and Caveats
This pairing is unusual: it correlates an Ethereum network usage metric with a Bitcoin price metric — two different assets across different mechanisms (usage vs. valuation). The strong observed correlation is very likely driven by a common confound: overall crypto market cycle/sentiment. Bull and bear markets tend to simultaneously increase both Bitcoin price and Ethereum network activity, without either causing the other — consistent with the null Granger result. Additionally, both series may be non-stationary (trending upward over multi-year periods, 2017–2026), which commonly inflates correlation coefficients between unrelated series (spurious correlation risk). Neither variable has been detrended or differenced, so part of the r² may reflect shared trend rather than genuine co-movement.
5. Actionable Insights and Further Investigation
- Test for stationarity (e.g., ADF test) and consider differencing both series or using percentage returns to check whether the correlation persists after removing shared trend — this would clarify if the relationship is genuine or an artifact of mutual growth over time. - Apply a log or log-log transformation to X (and possibly Y) given the heteroscedastic fan pattern and Spearman/Pearson discrepancy; a polynomial or logarithmic regression is likely to improve explanatory power. - Introduce a third variable (e.g., total crypto market cap, BTC/ETH trading volume, or a sentiment index) to test whether it Granger-causes both series, confirming the "common driver" hypothesis. - Given the lack of Granger causality, this relationship should not be used for short-term predictive trading models in either direction; it's more useful as a descriptive market-regime indicator (both series moving together as bull/bear signals) than a forecasting tool.
X dataset: CryptoDataDownload – Binance BTC/USDT Daily OHLCV
Y dataset: Ethereum Historical Data (Daily)
Part of experiment: Bitcoin - CryptoDataDownload – Binance BTC/USDT Daily OHLCV vs Ethereum Historical Data (Daily)