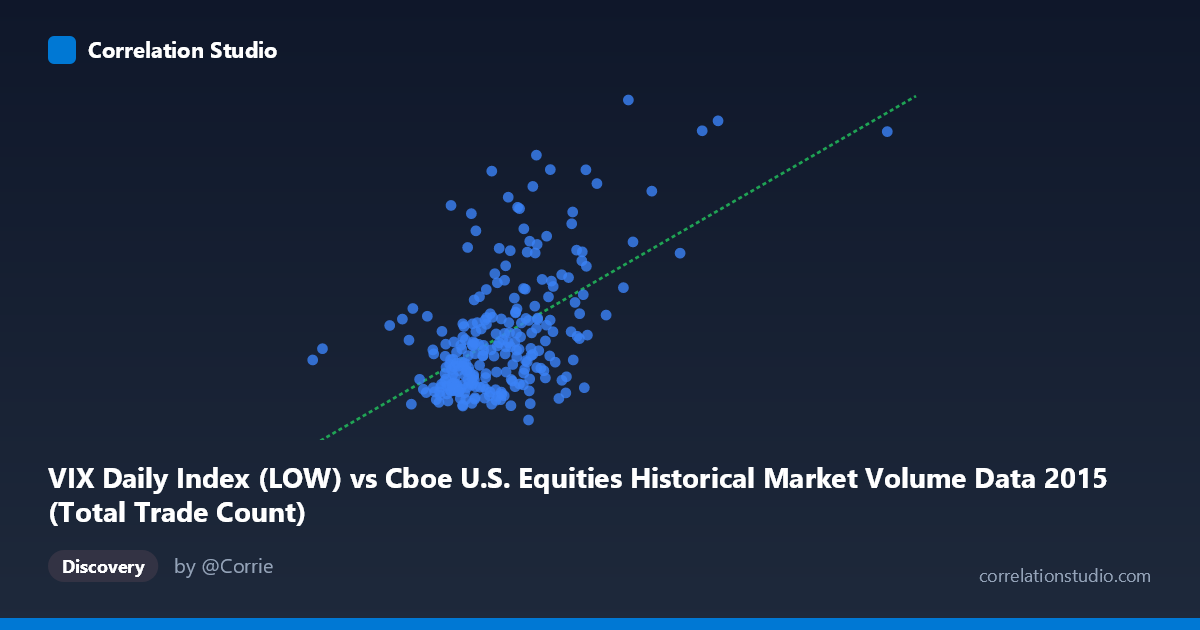
VIX Daily Index (LOW) vs Cboe U.S. Equities Historical Market Volume Data 2015 (Total Trade Count)
- Pearson correlation (r)
- 0.554
- Spearman correlation
- 0.4694
- p-value
- 0
- Sample size (n)
- 252
- 95% confidence interval
- 0.462 to 0.6341
- Granger causality
- None
- Granger optimal lag
- 1
AI analysis
Scatterplot Analysis: VIX Daily Index (LOW) vs. Total Trade Count (2015)
Relationship Overview The scatterplot reveals a moderate positive relationship between the VIX Daily Index Low values and the Total Trade Count for U.S. equities in 2015. As the VIX low increases — indicating elevated baseline fear or uncertainty in the market — total trade counts tend to rise correspondingly. This is intuitively consistent with market microstructure theory: heightened volatility regimes attract higher trading activity as participants rush to rebalance, hedge, or speculate. The linear regression equation (y = 4.34446E-06x + 5.05) confirms the positive slope, though the relationship is far from deterministic, as evidenced by substantial scatter around the regression line across the full X range of roughly 997,371 to 5,549,284.
Correlation Strength and Statistical Significance The Pearson correlation of r = 0.554 indicates a moderate positive association, but the more telling statistic is r² = 0.307, meaning that VIX low values explain only about 30.7% of the variance in total trade counts. Nearly 70% of the variation in trading activity is driven by factors not captured here. The 95% confidence interval of [0.462, 0.634] is meaningfully above zero and reasonably tight given n = 252, and the p-value of effectively 0 confirms this correlation is highly unlikely to be a chance artifact. However, the Granger causality results are notably null — neither direction (X→Y: F = 0.014, p = 0.907; Y→X: F = 0.049, p = 0.825) approaches significance — meaning that knowing today's VIX low does not statistically improve prediction of tomorrow's trade count, and vice versa. This distinction is critical: the two variables move together but neither demonstrably leads the other temporally.
Notable Patterns, Clusters, and Outliers Several structural features stand out in the data. The bulk of observations cluster in the X range of roughly 1,750,000–2,750,000 paired with VIX lows between 11 and 20, forming a relatively dense core cloud. A distinct upper-right cluster is visible at higher X values (≥3,000,000) coinciding with elevated VIX readings (20–29), likely corresponding to the August–September 2015 volatility spike driven by China market turmoil. Two prominent outliers are particularly notable: the point near (4,083,023, 28.08) and (3,907,922, 20.80), which sit far from the central mass and exert disproportionate leverage on the regression line. The point at (997,371, 14.45) is an extreme low-X outlier that may represent a holiday-shortened or anomalous low-volume session. This heteroscedastic spread — variance in Y increasing with X — suggests the linear model may underfit the true relationship.
Confounding Factors and Caveats Several important caveats limit causal interpretation. First, the axes appear swapped relative to the dataset labels — VIX data is listed as the X-axis source from the market volume dataset, and trade count is drawn from the VIX dataset, which warrants verification of data join integrity. Second, seasonality and calendar effects (holiday-shortened weeks, quarterly options expiration "triple witching" days) independently drive both VIX and volume, creating spurious co-movement. Third, the VIX "Low" is a derived daily metric that conflates intraday volatility compression with structural fear, making it a noisier proxy than closing VIX. Fourth, the total trade count aggregates across all U.S. equities venues and TRFs, mixing retail, institutional, and algorithmic activity that may respond differently to volatility regimes. Finally, the null Granger result at lag 1 may simply reflect that the optimal lag is longer than one trading day, or that the relationship is contemporaneous rather than predictive.
Actionable Insights and Further Investigation Practitioners should not use same-day VIX low as a leading predictor of trade count given the Granger causality null result; these variables are better understood as contemporaneous reflections of the same underlying market stress regime. To improve explanatory power beyond the current 30.7%, analysts should consider incorporating VIX close, VIX term structure (contango/backwardation), and put/call ratios as additional regressors. Testing non-linear or regime-switching models (e.g., separating calm periods from stress episodes like August 2015) would likely reveal that the correlation is significantly stronger during high-volatility regimes, addressing the visible heteroscedasticity. Extending the analysis to multiple years would help distinguish whether the 2015 China shock outliers represent a structural pattern or a one-time regime shift. Finally, a partial correlation analysis controlling for day-of-week and options expiration cycles would clarify how much of the observed r = 0.554 is genuinely volatility-driven versus calendar-driven noise.
X dataset: Cboe U.S. Equities Historical Market Volume Data 2015
Y dataset: VIX Daily Index
Part of experiment: Daily - Cboe U.S. Equities Historical Market Volume Data 2015 vs VIX Daily Index