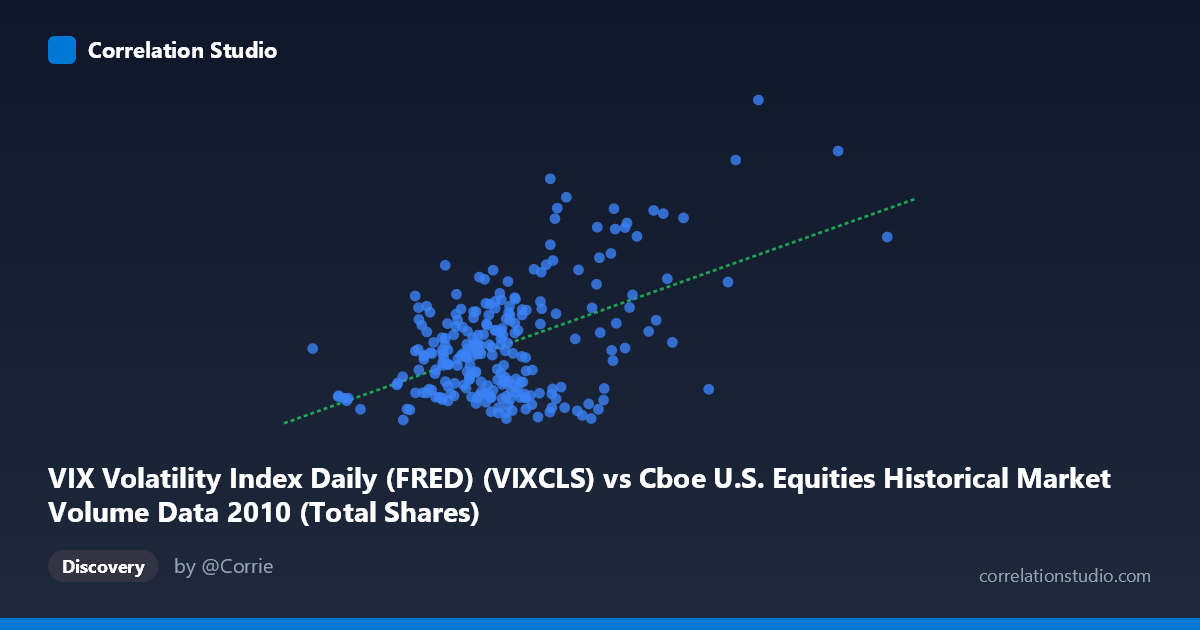
VIX Volatility Index Daily (FRED) (VIXCLS) vs Cboe U.S. Equities Historical Market Volume Data 2010 (Total Shares)
- Pearson correlation (r)
- 0.4969
- Spearman correlation
- 0.2639
- p-value
- 0
- Sample size (n)
- 252
- 95% confidence interval
- 0.3978 to 0.5846
- Granger causality
- Y → X
- Granger optimal lag
- 1
AI analysis
Analysis: VIX Volatility Index vs. U.S. Equity Market Volume (2010)
Relationship Overview
The scatterplot reveals a moderate positive relationship between U.S. equity market trading volume (X-axis) and the VIX Volatility Index (Y-axis) across 252 trading days in 2010. As market volume increases, VIX levels tend to rise as well, which is intuitively consistent with the well-established financial principle that heightened fear and uncertainty drive both volatility expectations and trading activity simultaneously. The linear regression equation (y = 1.37×10⁻⁸x + 13.52) confirms this positive slope, suggesting that for every ~73 million additional shares traded, VIX rises by approximately 1 point — though this relationship is far from deterministic.
Correlation Strength and Statistical Significance
The Pearson correlation of r = 0.497 indicates a moderate positive association, but the coefficient of determination r² = 0.247 is the more sobering figure: only ~24.7% of the variance in VIX is explained by trading volume, leaving roughly three-quarters of VIX fluctuations unexplained by volume alone. The 95% confidence interval [0.398, 0.585] is meaningfully above zero and relatively tight given the sample size (n = 252), and the p-value of effectively zero confirms this correlation is highly unlikely to be a statistical artifact. The Granger causality results add an important directional nuance: VIX Granger-causes trading volume (F = 6.46, p = 0.012), but the reverse is not statistically supported (F = 2.36, p = 0.126). This suggests that yesterday's VIX level helps predict today's trading volume, not the other way around — implying volatility sentiment leads market participation, rather than volume driving fear.
Patterns, Clusters, and Outliers
The scatterplot shows a clear central cluster of observations concentrated in the volume range of roughly 400–800 million shares with VIX values between 15 and 30, representing typical "calm" 2010 trading conditions. However, several notable outliers are visible in the upper-right quadrant: points at very high volumes (exceeding 900 million to ~1.6 billion shares) paired with elevated VIX readings (30–45), consistent with episodic market stress events such as the May 2010 Flash Crash and European sovereign debt contagion fears. The point near (1,476,963,723; 40.95) is particularly striking and likely represents an extreme stress day. There also appears to be meaningful heteroscedasticity — variance in VIX increases substantially at higher volume levels — suggesting the linear model underrepresents the complexity at market extremes.
Confounding Factors and Caveats
Several important caveats apply. First, reverse causality is plausible even beyond Granger results: VIX and volume are both endogenous to the same underlying market stress events, making clean causal attribution difficult. Second, seasonality plays a role — summer months typically see lower volume and volatility, while Q4 and stress periods see spikes, potentially inflating the observed correlation. Third, the dataset covers only 2010 — a single, historically unusual year defined by post-crisis recovery and specific macro shocks, limiting generalizability. Fourth, the VIX is forward-looking (implied volatility of S&P 500 options), while volume is a contemporaneous flow measure, making them conceptually distinct phenomena that share common drivers rather than a direct causal chain. The N=3,302 population figure versus the n=252 sample also warrants attention regarding representativeness.
Actionable Insights and Further Investigation
Practitioners could explore using lagged VIX as a leading indicator for volume-based trading strategy development, given the statistically significant Granger causality result. For researchers, fitting a non-linear or regime-switching model (e.g., separating high-stress vs. low-stress regimes using a VIX threshold around 30) would likely improve explanatory power beyond the 24.7% captured linearly. It would also be valuable to extend the analysis across multiple years (2008–2023) to test whether this relationship is stable or crisis-specific. Finally, controlling for day-of-week effects, options expiration cycles, and Fed announcement dates could help isolate the pure volume-volatility channel from calendar-driven noise.
X dataset: Cboe U.S. Equities Historical Market Volume Data 2010
Y dataset: VIX Volatility Index Daily (FRED)
Part of experiment: Daily - Cboe U.S. Equities Historical Market Volume Data 2010 vs VIX Volatility Index Daily (FRED)