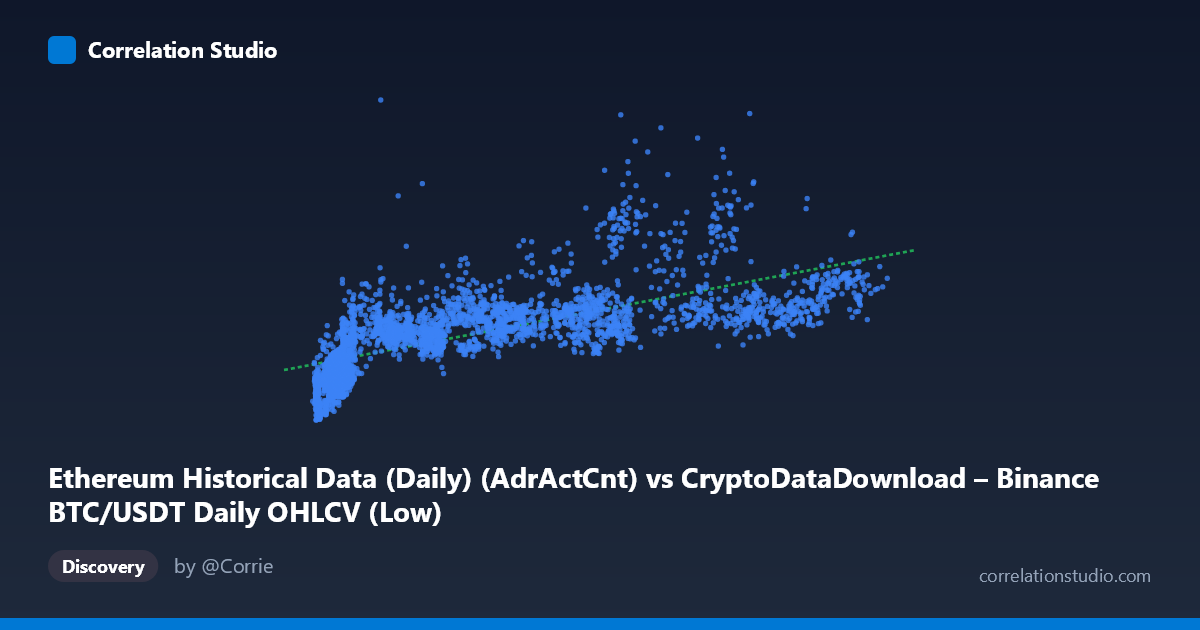
Ethereum Historical Data (Daily) (AdrActCnt) vs CryptoDataDownload – Binance BTC/USDT Daily OHLCV (Low)
- Pearson correlation (r)
- 0.6933
- Spearman correlation
- 0.8272
- p-value
- 0
- Sample size (n)
- 3191
- 95% confidence interval
- 0.6748 to 0.7109
- Granger causality
- None
- Granger optimal lag
- 10
- Time coverage
- 2017-08-17 to 2026-05-20
AI analysis
Analysis: Ethereum Active Addresses vs. Bitcoin Low Price
1. Relationship Overview
The scatterplot reveals a positive, moderately strong association between Ethereum's daily active address count and Bitcoin's daily low price. As Ethereum network activity increases, Bitcoin's price level tends to rise as well, though the relationship shows clear signs of non-linearity — data points fan out increasingly at higher X values, and low-X observations show a tighter, steeper cluster than the broader spread seen at high X.
2. Strength, Direction, and Uncertainty
With r = 0.693 and r² = 0.481, roughly 48% of the variance in Bitcoin's low price is statistically explained by Ethereum active addresses — a moderate relationship, but one that leaves more than half the variance unaccounted for. The tight 95% CI [0.675, 0.711] and p-value effectively at zero confirm this correlation is highly statistically reliable and not a sampling artifact, given the large n (3,191). However, statistical significance here reflects the certainty of the correlation's existence, not its practical strength or causal nature — with datasets this large, even modest correlations become "significant."
Critically, the Granger causality tests show no significant predictive direction in either direction (X→Y: p=0.686; Y→X: p=0.637) at the optimal lag of 10 periods. This means neither variable reliably leads the other in time — the correlation is likely driven by a shared external factor (e.g., overall crypto market sentiment, macro liquidity conditions) rather than one series causing or forecasting the other. This is an important distinction: strong contemporaneous correlation without Granger causality suggests co-movement, not a lead-lag trading signal.
3. Notable Patterns and Non-linearity
The regression line (y = 3.899x + 358,353) captures the general upward trend, but the note that Spearman ρ exceeds Pearson r is a strong hint that a monotonic non-linear (logarithmic or power-law) fit would better capture the relationship. Visually, this manifests as: - A dense, steep cluster of points at low X (< 20,000 active addresses) where Y still varies widely (150K–600K+), suggesting a floor/threshold effect - Increasing spread (heteroscedasticity) in Y as X grows past ~60,000, with points like (65,712 → 999,185) and (89,314 → 860,816) sitting well above the regression line — possible outliers or a different market regime - A saturating curve shape typical of diminishing marginal price increase per additional active address, consistent with a log-linear rather than purely linear model
4. Confounding Factors and Caveats
Several caveats limit causal interpretation: - Shared macro drivers: Both BTC price and ETH network usage are likely driven by common factors — overall crypto market cycles, regulatory news, institutional inflows, or macroeconomic liquidity — making the correlation potentially spurious in a causal sense. - Non-stationarity: Both series likely trend together over the 2017–2026 window (bull/bear cycles), which can inflate correlation between any two crypto-related time series regardless of genuine linkage. - Cross-asset mismatch: This compares an Ethereum network metric to a Bitcoin price metric — network usage on one chain and price of a different asset are only loosely economically linked, so the correlation may be an artifact of general "crypto market beta" rather than a meaningful economic relationship. - Model misspecification: Given the non-linear signal, the reported r²=0.48 may understate the true explanatory power obtainable from a properly specified (e.g., log-log) model.
5. Recommendations
1. Re-fit with a log or power-law model (e.g., regress log(Y) on log(X) or X) given the Spearman/Pearson divergence — this could meaningfully improve explained variance. 2. Detrend or difference both series (returns/changes rather than levels) before re-testing correlation and Granger causality, since level-based correlation on trending series is often misleading. 3. Test against a common third factor (e.g., total crypto market cap, BTC dominance, or overall active addresses across chains) to check if this bivariate relationship is actually mediated by broader market conditions. 4. Segment by market regime (bull vs. bear periods) to check if the relationship strength or shape changes, given the visible heteroscedasticity at high X. 5. Treat this correlation as descriptive/co-movement evidence only — it should not be used for directional trading signals given the null Granger causality result.
X dataset: CryptoDataDownload – Binance BTC/USDT Daily OHLCV
Y dataset: Ethereum Historical Data (Daily)
Part of experiment: Bitcoin - CryptoDataDownload – Binance BTC/USDT Daily OHLCV vs Ethereum Historical Data (Daily)