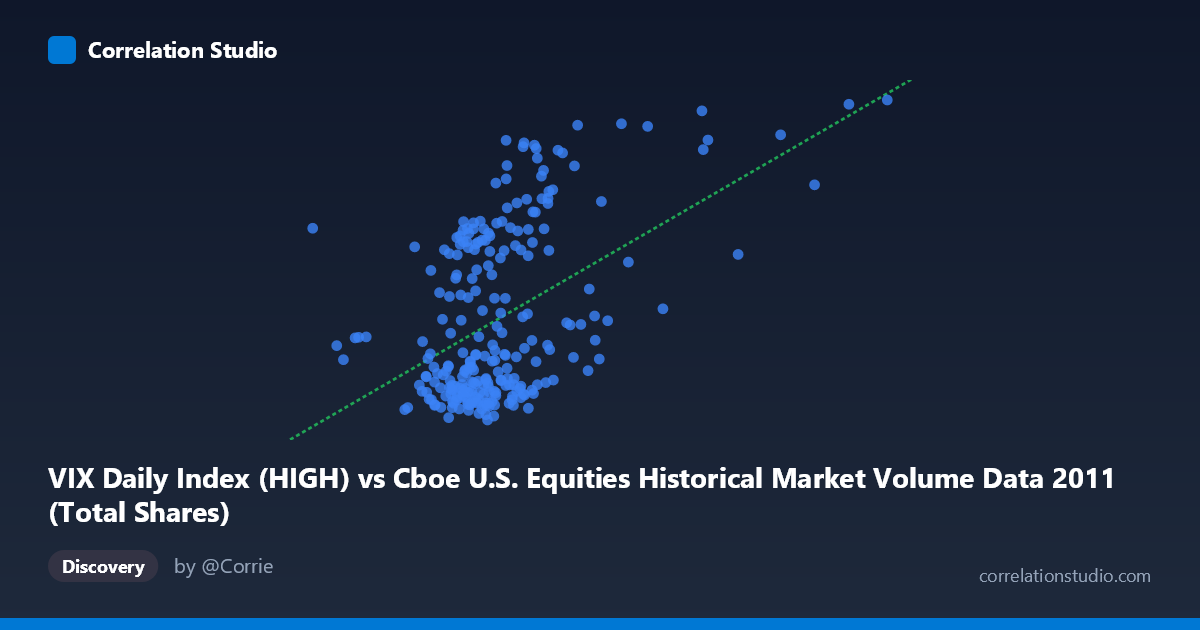
VIX Daily Index (HIGH) vs Cboe U.S. Equities Historical Market Volume Data 2011 (Total Shares)
- Pearson correlation (r)
- 0.4824
- Spearman correlation
- 0.3915
- p-value
- 0
- Sample size (n)
- 252
- 95% confidence interval
- 0.3816 to 0.5719
- Granger causality
- None
- Granger optimal lag
- 1
AI analysis
Scatterplot Analysis: VIX Daily Index (HIGH) vs. Total Shares Volume (2011)
Relationship Overview
The scatterplot reveals a moderate positive relationship between the CBOE VIX High values (X-axis, representing daily market volume/notional context from the Cboe equities dataset) and Total Shares traded (Y-axis, from the VIX Daily Index dataset) across 252 trading days in 2011. The linear regression equation (y = 3.45E-08x + 7.38) confirms the upward slope, suggesting that as market volume activity increases, VIX High readings tend to rise correspondingly. This aligns intuitively with the well-established market dynamic where elevated volatility — as measured by VIX — tends to coincide with periods of heightened trading activity, as market participants react more aggressively to uncertainty.
Correlation Strength and Statistical Significance
The correlation coefficient of r = 0.4824 indicates a moderate positive association, but the explanatory power is more sobering: r² = 0.2327 means only ~23.3% of the variance in VIX High is explained by Total Shares volume, leaving roughly 77% attributable to other factors. The 95% confidence interval of [0.3816, 0.5719] is meaningfully above zero and relatively tight given the sample size (n = 252 from a population of N = 3,780), lending confidence that the relationship is real and not an artifact of sampling. The p-value of 4.44E-16 is extraordinarily small, confirming the correlation is highly statistically significant. However, Granger causality tests reveal no significant temporal predictive direction in either direction (X→Y: F = 0.21, p = 0.65; Y→X: F = 0.01, p = 0.91), meaning neither variable meaningfully predicts the other's future values at a one-period lag. This critically distinguishes statistical association from predictive or causal utility.
Notable Patterns, Clusters, and Outliers
The scatterplot exhibits several visually distinct features. There appears to be a dense cluster of points at lower X values (roughly 300M–600M range) with Y values concentrated between ~15–25, suggesting a baseline regime of moderate volume and relatively contained volatility. A secondary, more dispersed cluster emerges at higher Y values (30–48 range), indicating episodic volatility spikes. Several notable outliers appear in the upper regions — points with Y values approaching 42–48 (e.g., coordinates near (588M, 43.0), (878M, 42.9), (590M, 42.0)) — which likely correspond to specific market stress events in 2011, such as the U.S. debt ceiling crisis (August) and European sovereign debt contagion fears. The relationship also appears to have a non-linear character, with variance in Y increasing substantially at higher X values (heteroscedasticity), suggesting a simple linear model may underfit the true dynamics.
Confounding Factors and Interpretive Caveats
Several important caveats apply. First, the axis labeling appears inverted in the dataset metadata — VIX data is listed as the X-source while Total Shares is listed as the Y-source from the VIX dataset — which warrants verification before drawing firm conclusions. Second, 2011 was an unusually volatile year featuring multiple macro-level shocks (S&P U.S. credit downgrade, Eurozone crisis, Arab Spring), meaning these results may not generalize to calmer market environments. Third, volume and volatility share common drivers — risk-off sentiment, institutional repositioning, algorithmic trading responses — making it difficult to disentangle which is the signal and which is the response. The absence of Granger causality at lag-1 suggests both variables are likely contemporaneously driven by a common latent factor (e.g., news shocks, macro events) rather than one causing the other sequentially.
Actionable Insights and Further Investigation
Given the moderate correlation and lack of Granger causality, practitioners should avoid using volume alone as a predictive signal for VIX direction in short-term trading strategies. Instead, this relationship is better interpreted as a concurrent indicator — high volume and high VIX co-occur but neither robustly leads the other. Further investigation should include: (1) testing multiple lag structures beyond lag-1 for Granger causality, as volatility feedback effects may operate over longer horizons; (2) regime-based segmentation to test whether the correlation strengthens during identified stress periods (e.g., August–September 2011) versus calm periods; (3) adding intermediary variables such as put/call ratios, bid-ask spreads, or news sentiment indices to build a more complete causal model; and (4) applying non-linear models (e.g., quantile regression or spline fits) to better capture the apparent heteroscedastic structure visible in the upper tail of the distribution.
X dataset: Cboe U.S. Equities Historical Market Volume Data 2011
Y dataset: VIX Daily Index
Part of experiment: Daily - Cboe U.S. Equities Historical Market Volume Data 2011 vs VIX Daily Index