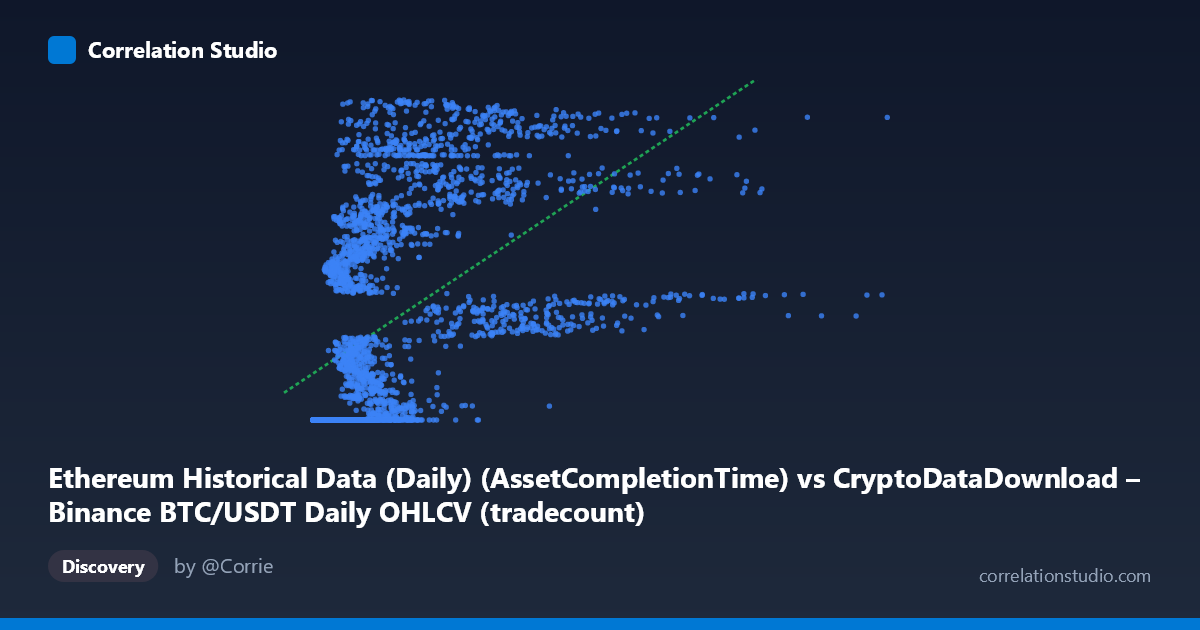
Ethereum Historical Data (Daily) (AssetCompletionTime) vs CryptoDataDownload – Binance BTC/USDT Daily OHLCV (tradecount)
- Pearson correlation (r)
- 0.5262
- Spearman correlation
- 0.7892
- p-value
- 0
- Sample size (n)
- 3191
- 95% confidence interval
- 0.5007 to 0.5509
- Granger causality
- None
- Granger optimal lag
- 10
- Time coverage
- 2017-08-17 to 2026-05-20
AI analysis
Analysis of the X–Y Relationship
1. What the visualization reveals
The scatterplot shows a distinctly non-linear pattern rather than a simple linear trend. At low X values (roughly below ~1,000,000), Y is tightly clustered near its floor (~1,614,335,000), forming a dense horizontal band regardless of X. As X increases beyond that threshold, Y rises quickly and then spreads into a much wider range (up to ~1,779,000,000), producing a shape more consistent with a logarithmic, step-like, or saturating curve than a straight line. This suggests the relationship is threshold-like: small X values correspond to a "floor" state in Y, while larger X values unlock much greater variability and higher Y values.
2. Strength, direction, and statistical meaning
The Pearson correlation (r = 0.526) indicates a moderate positive linear relationship, with r² = 0.277 meaning only about 28% of the variance in Y is explained by X in a linear model — the majority of Y's variability is driven by other factors or by a non-linear component not captured here. The 95% CI [0.501, 0.551] is fairly narrow and the p-value is effectively 0, so we can be confident the positive association is real and not due to chance — but statistical significance here reflects the large sample size (n=3,191) more than practical predictive strength. Critically, the Granger causality tests show no significant predictive direction in either direction (X→Y: p=0.446; Y→X: p=0.661), meaning that despite the contemporaneous correlation, past values of one series do not help forecast future values of the other. This strongly implies the correlation is likely driven by a shared external trend (e.g., both series trending upward over the 2017–2026 window) rather than any causal or lead-lag mechanism between them.
3. Notable patterns and features
The most striking feature is the "floor and rise" structure: a large subset of points sit almost exactly at Y ≈ 1,614,335,000 across a wide range of low-to-moderate X values, resembling a censored or minimum-bound value (possibly an early period where tradecount was low/constant, or a data-collection artifact). Once X crosses roughly 1,000,000–2,000,000, Y values fan out substantially, with many points reaching 1,650,000,000–1,780,000,000. This is consistent with the note that Spearman ρ exceeds Pearson r — a monotonic but curved (log-like) relationship fits better than a straight line. There's no evidence of extreme outliers so much as a structural regime change/inflection point in the data.
4. Confounding factors and caveats
Because both variables are time series (BTC/USDT OHLCV-derived X and Ethereum-derived Y, spanning 2017–2026), the correlation is highly susceptible to spurious correlation from shared trends — both crypto markets have grown/matured over this period, so common macro drivers (adoption growth, bull/bear cycles, exchange volume growth) could inflate r without any direct link between the specific columns. The mismatched dataset labeling (X described as an Ethereum "AssetCompletionTime" field is actually documented as BTC/USDT data, and Y is labeled as Ethereum tradecount) also raises concern about metadata/column alignment errors, which should be verified before drawing conclusions. Additionally, the floor artifact in Y suggests possible data quality issues (e.g., missing data imputed with a constant, or a metric capped at zero/minimum for early dates) that would bias both the correlation and the regression fit.
5. Actionable insights
Given the linear model only explains 28% of variance and the relationship visibly curves, refitting with a log or logistic transformation of X (or a piecewise/segmented regression around the apparent threshold) would likely improve fit and interpretability — try re-running correlation on log(X) vs Y. Since Granger tests show no lead-lag predictability, this pair should not be used for forecasting one from the other's history; instead, investigate a common third factor (e.g., time/date itself, or overall market capitalization) as the true driver. Finally, verify data provenance and clean the apparent floor/censoring artifact in Y before further modeling, and consider splitting the analysis into "early flat regime" vs. "later variable regime" periods to separately characterize each behavior.
X dataset: CryptoDataDownload – Binance BTC/USDT Daily OHLCV
Y dataset: Ethereum Historical Data (Daily)
Part of experiment: Bitcoin - CryptoDataDownload – Binance BTC/USDT Daily OHLCV vs Ethereum Historical Data (Daily)