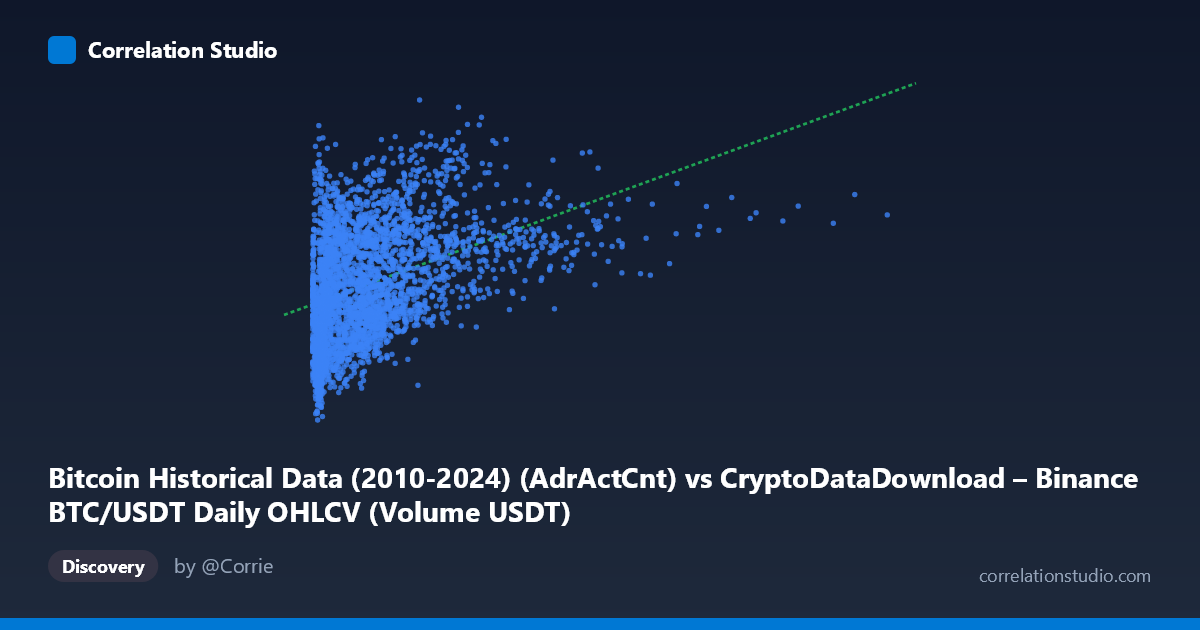
Bitcoin Historical Data (2010-2024) (AdrActCnt) vs CryptoDataDownload – Binance BTC/USDT Daily OHLCV (Volume USDT)
- Pearson correlation (r)
- 0.4086
- Spearman correlation
- 0.4587
- p-value
- 0
- Sample size (n)
- 3191
- 95% confidence interval
- 0.3793 to 0.4371
- Granger causality
- None
- Granger optimal lag
- 10
AI analysis
Analysis: Bitcoin Active Address Count vs. Volume (USDT)
1. Overview of the Relationship
The scatterplot depicts 3,191 paired daily observations relating Bitcoin's active address count (X) to Binance BTC/USDT trading volume (Y) between 2017 and 2026. The data shows a positive but modest association: as the number of active on-chain addresses increases, USDT trading volume tends to rise as well, though with substantial scatter. The relationship appears to be non-linear or heteroscedastic in nature — X spans an enormous range (roughly 978 to 17.5 billion), while Y is comparatively compact (415K to 1.37M), suggesting the two variables operate on very different scales and that the extreme values in X (likely data anomalies, see below) are exerting outsized leverage on the fit.
2. Strength, Direction, and Statistical Confidence
The correlation coefficient (r = 0.409) indicates a weak-to-moderate positive linear relationship. The r² of 0.167 means only about 16.7% of the variance in trading volume is explained by active address count — leaving over 83% of Y's variability attributable to other factors. Despite this modest explanatory power, the relationship is statistically robust: the 95% CI [0.379, 0.437] is tight and excludes zero, and the p-value is effectively 0, confirming the correlation is real and not due to chance, given the large sample size (n=3,191). However, statistical significance here reflects sample size more than practical strength — this is a weak-to-moderate relationship, not a strong predictive one. Critically, the Granger causality tests show no significant directional predictability in either direction (X→Y: p=0.407; Y→X: p=0.857) at the tested lag structure (10 periods). This means neither variable helps forecast future values of the other beyond their own historical patterns — the correlation is likely contemporaneous/structural (both driven by common market conditions) rather than causal in a lead-lag sense.
3. Patterns, Clusters, and Outliers
The sample points reveal a dense cluster of X values below ~5 billion, with Y ranging broadly from ~600K to ~1.15M regardless of the specific X value in that cluster — indicating a "floor" relationship where address count alone doesn't tightly constrain volume within normal ranges. A few points with very small X (near 1,000–3,000, e.g., 977865.73 and 2,682,483.74) sit alongside mid-range Y values, hinting these may be data errors, non-trading days, or a different unit scale. The extreme X maximum (17.47 billion) is a strong outlier candidate — it's ~9x the mean plus multiple standard deviations away, and likely a single anomalous data point that could disproportionately affect the regression slope and r² despite the metric's expected daily range being far smaller. No clear saturation or threshold effect is evident from the sample, but the wide X range relative to Y suggests possible log-scale mismatches.
4. Confounding Factors and Caveats
Several caveats merit attention: (1) Unit/scale mismatch — "Active address count" typically ranges in the hundreds of thousands, not billions; the X range suggests this column may actually represent a different or corrupted metric (possibly market cap, cumulative volume, or a unit error), which would invalidate straightforward interpretation as "addresses." (2) Confounding market-wide drivers — both active addresses and trading volume are likely jointly driven by Bitcoin price volatility, news events, and macro crypto sentiment, producing spurious correlation without direct causation. (3) Temporal structure — cryptocurrency data often exhibits volatility clustering and regime changes (bull/bear markets) that violate the i.i.d. assumptions underlying simple correlation; this could inflate or deflate r depending on regime mix in the sample. (4) Outlier sensitivity — given r² is already low, extreme values in X could be inflating or suppressing the correlation estimate.
5. Recommendations for Further Investigation
Before drawing conclusions, verify the X-axis data source and units — the described range strongly suggests a data quality issue (mismatched columns, incorrect scaling, or duplicate/cumulative values) that should be resolved first. Once cleaned, consider: (a) applying log transformations to both variables given the skewed distributions, which may reveal a more linear or tighter relationship; (b) segmenting analysis by market regime (bull/bear/sideways) to check for regime-dependent correlation strength; (c) testing Granger causality with alternative lag structures (e.g., 1-5 days) since crypto markets often react faster than 10-period lags capture; and (d) exploring whether a third variable (e.g., BTC price or volatility) mediates the observed relationship, using partial correlation or multivariate regression to isolate genuine explanatory power.
X dataset: CryptoDataDownload – Binance BTC/USDT Daily OHLCV
Y dataset: Bitcoin Historical Data (2010-2024)
Part of experiment: Bitcoin - CryptoDataDownload – Binance BTC/USDT Daily OHLCV vs Bitcoin Historical Data (2010-2024)