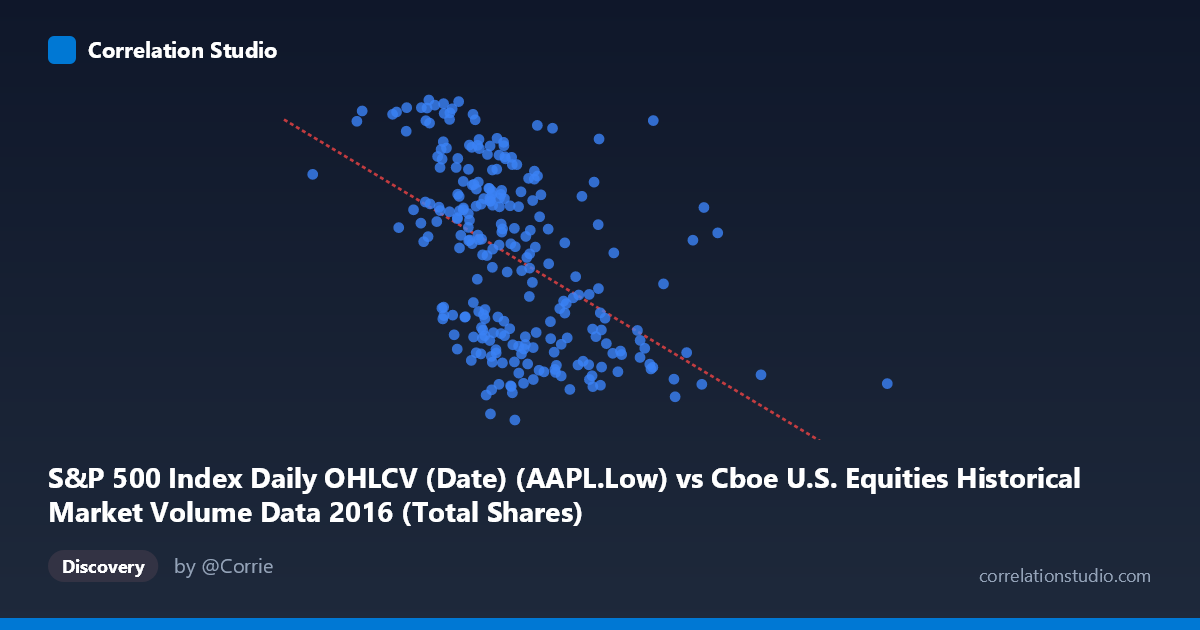
S&P 500 Index Daily OHLCV (Date) (AAPL.Low) vs Cboe U.S. Equities Historical Market Volume Data 2016 (Total Shares)
- Pearson correlation (r)
- -0.4908
- Spearman correlation
- -0.5228
- p-value
- 0
- Sample size (n)
- 252
- 95% confidence interval
- -0.5793 to -0.3909
- Granger causality
- None
- Granger optimal lag
- 1
AI analysis
Scatterplot Analysis: AAPL Low Price vs. Cboe Total Shares Volume (2016)
Relationship Overview The scatterplot reveals a moderate negative relationship between Apple's daily low price (X-axis) and total U.S. equities shares traded on Cboe exchanges (Y-axis) across 252 trading days in 2016. As AAPL's low price increases, total market share volume tends to decrease. This inverse pattern is visually apparent in the downward slope of the regression line (y = -3.377×10⁻⁸x + 121.003), though the scatter around that line is substantial, indicating the relationship is real but far from deterministic. The data spans a meaningful range — AAPL low prices from roughly $89 to $117 — capturing the full arc of Apple's stock movement throughout 2016, including its recovery from early-year lows.
Correlation Strength and Statistical Significance The Pearson correlation of r = -0.49 indicates a moderate negative association, but the more informative metric is R² = 0.2409, meaning that AAPL's low price explains only about 24.1% of the variance in total Cboe share volume. The remaining ~76% is driven by factors entirely outside this relationship. The 95% confidence interval of [-0.579, -0.391] is entirely negative and does not cross zero, and the p-value is effectively 0, confirming this correlation is statistically robust and almost certainly not a sampling artifact given n = 252. However, statistical significance should not be conflated with practical importance — a quarter of explained variance represents a meaningful but partial signal at best. Critically, the Granger causality tests show no significant predictive directionality in either direction (X→Y: F = 0.89, p = 0.35; Y→X: F = 1.76, p = 0.19), meaning that knowing AAPL's low price today does not help forecast tomorrow's Cboe volume, and vice versa. The correlation is contemporaneous rather than predictively useful.
Notable Patterns, Clusters, and Outliers Several features stand out in the sample data. There is a visible clustering of observations in the $430–$560M AAPL low price range (roughly the middle of the X distribution), where Y values scatter widely from ~89 to ~117 billion shares, suggesting high variability in volume even at similar price levels. A few potential outliers are noticeable: the point near (514M, 89.47) represents an unusually low share volume day, while points like (369M, 116.78) and (549M, 115.23) sit at extremes of the Y distribution. The observation at approximately (708M, 94.94) is a notable high-X outlier — a day with an unusually elevated AAPL low price that also shows relatively suppressed volume. There is also a hint of heteroscedasticity: variability in Y appears somewhat wider at lower X values, which could mildly violate linear regression assumptions.
Confounding Factors and Interpretive Caveats This correlation warrants careful interpretation for several reasons. First, the axis labels appear to be swapped in the dataset metadata — AAPL Low prices are listed as coming from the Cboe dataset and vice versa, which may reflect a data joining artifact and should be verified before drawing firm conclusions. Second, both variables are time-indexed through 2016, meaning shared temporal trends (e.g., broad market recovery after the January 2016 selloff, pre-election volatility in Q4) could be driving the apparent correlation rather than any direct relationship between AAPL's price level and overall market volume. This is a classic spurious temporal correlation risk. Third, total Cboe share volume is a macro market-wide metric, while AAPL low is a single-stock price — any causal story connecting them would require a strong theoretical mechanism (e.g., AAPL as a market sentiment proxy), which the Granger results explicitly fail to support.
Actionable Insights and Further Investigation Given the moderate but temporally non-predictive correlation, several follow-up analyses are warranted. Detrending both series (e.g., using first differences or removing seasonal effects) would isolate whether the correlation persists independently of shared 2016 market trends, or dissolves once temporal structure is removed. It would also be valuable to test this relationship against broader market indices (e.g., S&P 500 level or VIX) to determine whether AAPL's low price is simply a proxy for overall market conditions. Extending the Granger causality test to longer lags (beyond the optimal lag-1 tested here) could reveal delayed predictive relationships not captured at daily frequency. Finally, segmenting the data by market regime (e.g., low-volatility vs. high-volatility periods) may reveal whether the negative correlation strengthens meaningfully during stress periods, which would have more practical trading or risk management relevance.
X dataset: Cboe U.S. Equities Historical Market Volume Data 2016
Y dataset: S&P 500 Index Daily OHLCV (Date)
Part of experiment: Daily - Cboe U.S. Equities Historical Market Volume Data 2016 vs S&P 500 Index Daily OHLCV (Date)