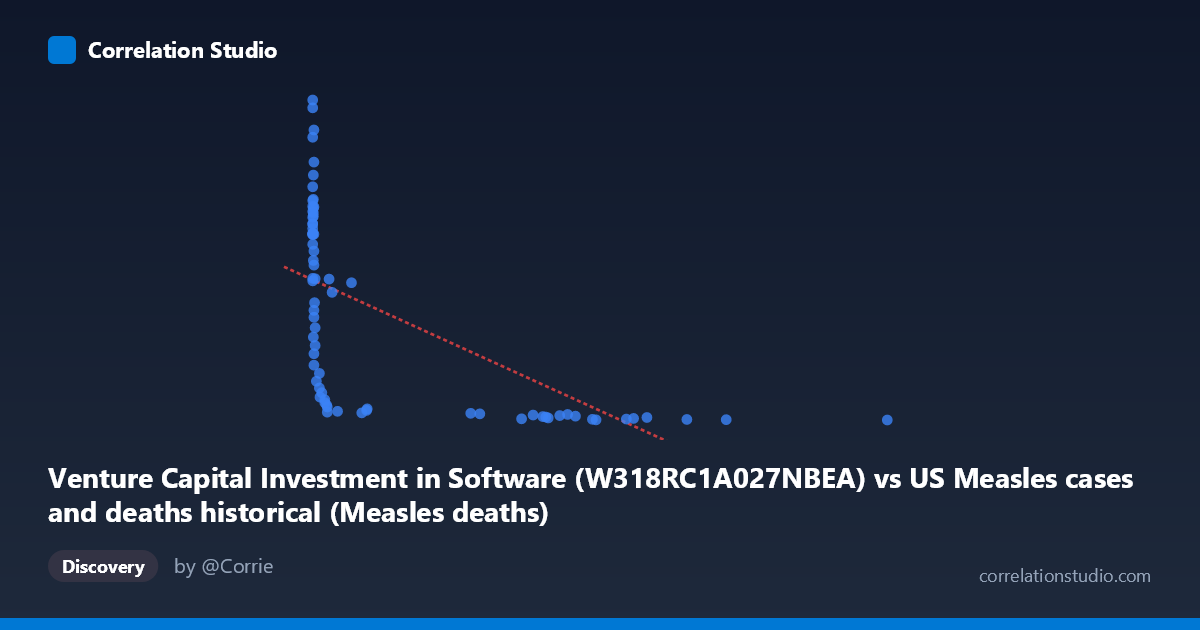
Venture Capital Investment in Software (W318RC1A027NBEA) vs US Measles cases and deaths historical (Measles deaths)
- Pearson correlation (r)
- -0.6046
- Spearman correlation
- -0.8906
- p-value
- 0
- Sample size (n)
- 74
- 95% confidence interval
- -0.732 to -0.4364
- Granger causality
- None
- Granger optimal lag
- 10
AI analysis
Analysis: Venture Capital Software Investment vs. US Measles Deaths
1. What the Visualization Reveals
The scatterplot displays a striking distributional pattern rather than a clean linear relationship. The data points cluster heavily near the origin on the X-axis (many observations with X ≈ 0–100), where Y values (measles deaths) span an enormous range from roughly 12 to 466. As X increases beyond ~100, Y values collapse dramatically toward near-zero, with large X values (300–949) consistently associated with very low measles death counts (1–11). This creates a pronounced hyperbolic or L-shaped curve — the hallmark of two variables that declined over the same historical era rather than one causing the other.
2. Correlation Strength, Direction, and Predictive Value
The Pearson r of -0.605 indicates a moderate-to-strong negative correlation, but the r² of 0.366 is the more sobering statistic: only 36.6% of the variance in measles deaths is explained by software VC investment. The 95% confidence interval of [-0.732, -0.436] is reasonably tight and excludes zero, and the p-value of 1.165×10⁻⁸ confirms the correlation is extremely unlikely to be a sampling artifact. However, statistical significance here is essentially confirming that both variables changed over time — not that they are meaningfully connected. Critically, the Granger causality analysis finds no significant predictive direction in either direction (X→Y: p=0.651; Y→X: p=0.559), meaning neither variable temporally predicts the other when lags are accounted for. This strongly undermines any causal interpretation of the correlation.
3. Notable Patterns, Clusters, and Non-Linearity
The data exhibits a clear non-linear, hyperbolic structure. The note that Spearman ρ exceeds Pearson r independently confirms this — a logarithmic or power-law fit would almost certainly outperform the linear regression (y = -0.400x + 205). There are two dominant clusters: a dense vertical cloud at X ≈ 0 with Y ranging from ~12 to 466, and a horizontal cluster at Y ≈ 1–20 across X values of 250–949. Several points warrant attention as potential outliers: the observation at (0, 466) represents an extreme measles death year before VC investment existed, and (949, 1.33) anchors the far end of software investment era with near-zero deaths. The point at (64, 201) sits somewhat anomalously between the two clusters.
4. Confounding Factors and Caveats
This correlation is a textbook example of a spurious temporal confound. Both variables are driven overwhelmingly by the passage of time: measles deaths plummeted due to the 1963 measles vaccine introduction, improved healthcare infrastructure, and public health campaigns — entirely independent of software investment. Meanwhile, VC investment in software grew exponentially from the 1980s onward as the tech industry matured. Any third variable trending monotonically over this 1949–2022 period would produce a similarly "significant" negative correlation with measles deaths. The dataset labeling also deserves scrutiny — the axes appear swapped in metadata descriptions, suggesting a possible data provenance or labeling issue that should be verified before drawing any conclusions.
5. Actionable Insights and Further Investigation
The primary actionable insight is straightforward: this correlation should not be used for any inferential or policy purpose — it is a spurious artifact of shared temporal trends. To investigate these variables properly, one should: (1) detrend both series (e.g., first-differencing or residualizing against time) before computing correlations; (2) apply a logarithmic transformation to X given the Spearman/Pearson discrepancy and the apparent non-linearity; (3) use interrupted time series analysis around the 1963 vaccine introduction as a natural experiment to properly model measles mortality; and (4) if the research goal is genuinely about VC investment impacts, pair it with relevant outcome variables such as software employment rates, productivity metrics, or GDP contributions rather than unrelated public health data. This pairing serves as a useful pedagogical example of why correlation coefficients without causal scaffolding can be deeply misleading.
X dataset: US Measles cases and deaths historical
Y dataset: Venture Capital Investment in Software
Part of experiment: Yearly - US Measles cases and deaths historical vs Venture Capital Investment in Software