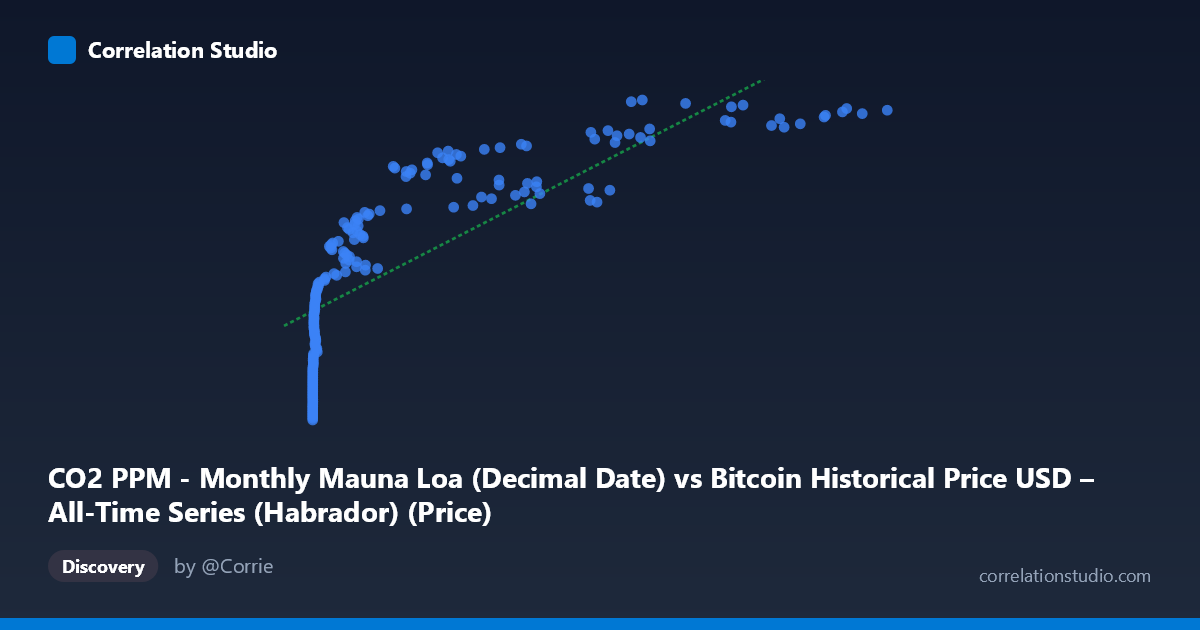
CO2 PPM - Monthly Mauna Loa (Decimal Date) vs Bitcoin Historical Price USD – All-Time Series (Habrador) (Price)
- Pearson correlation (r)
- 0.8009
- Spearman correlation
- 0.9723
- p-value
- 0
- Sample size (n)
- 189
- 95% confidence interval
- 0.7432 to 0.8469
- Granger causality
- None
- Granger optimal lag
- 1
- Time coverage
- 2010-08-01 to 2026-04-01
- Recomputed on refreshed data
- 2026-10-15 (r was 0.8009)
AI analysis
Analysis: Bitcoin Price vs. Atmospheric CO2 (Mauna Loa)
1. What the Visualization Reveals
This scatterplot is a striking example of a spurious correlation produced by two unrelated time series that both happen to trend upward over the same historical window (2010–2026). The X-axis (Bitcoin price, log-scale in practice given its range from $0.06 to $118,670) and Y-axis (CO2 PPM, ranging narrowly from ~2010.6 to ~2026.3 — note the axis label mismatch, discussed below) both increase monotonically over time. The visual pattern is less a "relationship between two phenomena" and more two independent growth curves plotted against each other via a shared clock.
2. Strength, Direction, and Statistical Interpretation
The Pearson r = 0.80 (r² = 0.64) indicates a strong positive linear association, with 64% of variance in Y "explained" by X — but this explanatory power is almost certainly an artifact of shared temporal trend, not causal mechanism. The tight 95% CI [0.743, 0.847] and p≈0 reflect that this correlation is highly statistically robust — but statistical significance here only confirms the trend co-movement is real and repeatable, not that it's meaningful. Critically, the Granger causality tests are decisively null in both directions (X→Y: p=0.83; Y→X: p=0.146). This means neither series has predictive power over the other's future values once autocorrelation is accounted for — strong evidence against any causal or leading/lagging relationship. This is the key finding that should override the seductive r² value: high correlation, no predictive causality.
3. Notable Patterns and Non-linear Features
The data show clear non-linear structure: Bitcoin's growth is exponential (values cluster near-zero for years, then explode into tens of thousands), while the "CO2" values increase in a near-linear, low-variance fashion (stdev only 4.55 over a mean of 2018). The note that Spearman ρ exceeds Pearson r confirms rank-order association is stronger than linear fit — consistent with Bitcoin's exponential/log-shaped curve against a steadily linear Y. A log-transform of X would likely substantially improve linear fit and r².
4. Confounding Factors and Caveats
The most important caveat is a metadata/axis-labeling anomaly: the Y column is described as "Bitcoin Historical Price USD" but its values (2010–2026, stdev 4.55) look like decimal dates, not CO2 ppm (which should be ~390–420) or USD price. Conversely, the X column ("CO2 PPM... Decimal Date") contains values up to 118,670 — consistent with Bitcoin price, not a date or CO2 reading. This strongly suggests the axes/columns have been swapped or mislabeled in the dataset merge. Beyond this data-integrity issue, the fundamental confounder is time itself: both series are monotonic functions of calendar date, so any two long-term-trending series (stock prices, population, temperature, etc.) would show similar spurious correlation.
5. Recommendations
- First, resolve the axis/column mislabeling — verify which values are actually CO2 ppm vs. Bitcoin USD vs. decimal date before any further inference. - Do not interpret r²=0.64 as evidence of a real relationship; treat this as a textbook case for teaching spurious correlation via shared trend. - If investigating a genuine relationship (e.g., Bitcoin mining energy use → emissions), use detrended or differenced series (e.g., month-over-month % change) and re-run correlation/Granger tests on stationary data. - The null Granger results should be treated as the primary finding — no predictive relationship exists between these series in their current form.
X dataset: Bitcoin Historical Price USD – All-Time Series (Habrador)
Y dataset: CO2 PPM - Monthly Mauna Loa
Part of experiment: Bitcoin - Bitcoin Historical Price USD – All-Time Series (Habrador) vs CO2 PPM - Monthly Mauna Loa