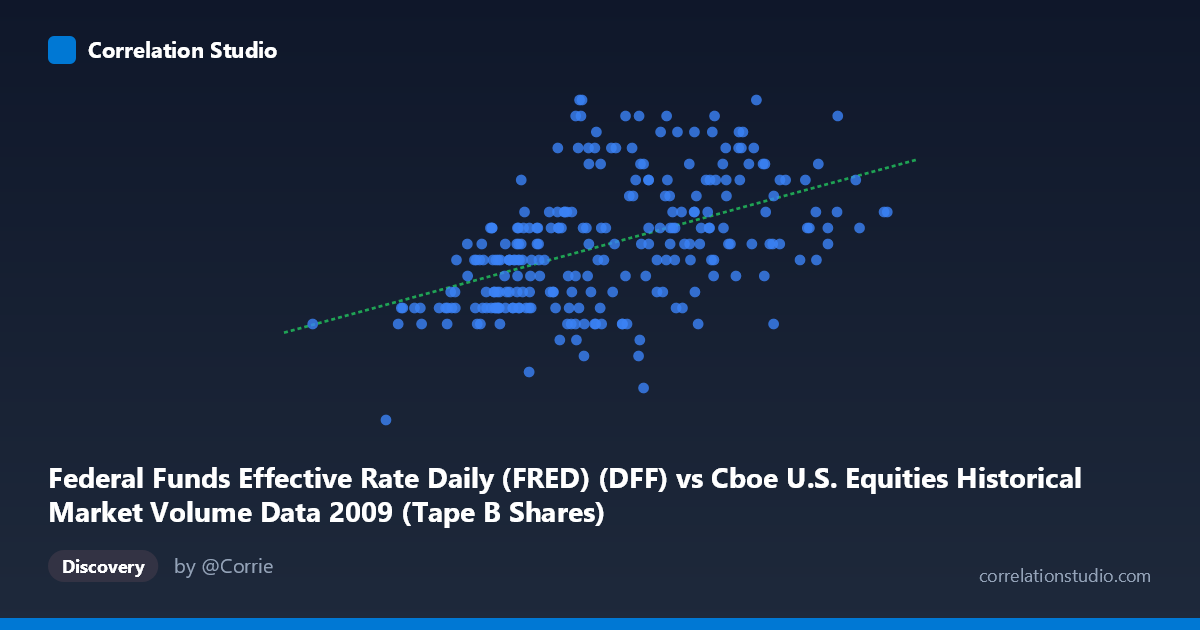
Federal Funds Effective Rate Daily (FRED) (DFF) vs Cboe U.S. Equities Historical Market Volume Data 2009 (Tape B Shares)
- Pearson correlation (r)
- 0.4866
- Spearman correlation
- 0.5312
- p-value
- 0
- Sample size (n)
- 252
- 95% confidence interval
- 0.3863 to 0.5756
- Granger causality
- None
- Granger optimal lag
- 1
AI analysis
Scatterplot Analysis: Federal Funds Rate vs. Tape B Share Volume (2009)
Relationship Overview The scatterplot reveals a modest positive relationship between the Federal Funds Effective Rate (x-axis) and Cboe Tape B share volume (y-axis) across 252 trading days in 2009. As the fed funds rate increases, Tape B share volume shows a general upward tendency, though the scatter is considerable and the relationship is far from deterministic. The linear regression equation (y = 4.42×10⁻¹⁰x + 0.0945) reflects an extremely small slope coefficient, which makes intuitive sense given the large scale difference between the variables — x values spanning ~33M to ~256M while y ranges only from 0.05 to 0.25.
Correlation Strength and Statistical Significance The Pearson correlation of r = 0.487 indicates a moderate positive association, but the r² of 0.237 means only ~23.7% of the variance in Tape B volume is explained by the fed funds rate, leaving roughly 76% attributable to other factors. The 95% confidence interval [0.386, 0.576] is reasonably tight and does not include zero, and the p-value of 2.22×10⁻¹⁶ confirms the relationship is highly statistically significant given the population size of N = 3,232. However, statistical significance here is partly a function of the large sample, and practical significance remains limited. Critically, the Granger causality tests reveal no significant predictive directionality in either direction (X→Y: F = 0.90, p = 0.34; Y→X: F = 0.81, p = 0.37), meaning neither variable reliably predicts the other temporally at lag-1. This strongly cautions against any causal interpretation.
Notable Patterns and Outliers The sample points reveal several features worth noting. There is a visible cluster of observations in the x-range of roughly 100M–200M with y-values concentrated between 0.10–0.20, representing the "core" of typical 2009 trading conditions. A handful of high-volume outliers appear at the upper right (e.g., ~255M at y = 0.18, ~244M at y = 0.20), and a notable low-x outlier exists at approximately (33.8M, 0.11), likely corresponding to an early January low-activity day or holiday-adjacent session. Some high-y values (0.23–0.25) appear at intermediate x-values (~168M–198M), suggesting the linear model may not fully capture the spread at mid-range fed funds rate levels. The data does not exhibit obvious non-linear curvature, but the variance in y appears to widen slightly at higher x values, hinting at mild heteroscedasticity.
Confounding Factors and Caveats The most important caveat is that 2009 was an extraordinary year — the Federal Reserve had slashed the fed funds rate to near-zero in response to the financial crisis, meaning the rate was largely pinned in a very narrow range (0.07%–0.25%) throughout the year. What appears as variation in x may partly reflect temporal drift or specific policy announcement dates rather than genuine rate variability. Furthermore, both variables share a common temporal driver: market conditions and Federal Reserve policy responses evolved jointly throughout 2009's recovery, making it very likely that time itself (or broader macro conditions) is a lurking confound producing the observed correlation. Tape B volume specifically captures mid-cap/regional exchange activity, which may have its own liquidity dynamics unrelated to overnight lending rates.
Actionable Insights and Further Investigation Given the lack of Granger causality, this correlation should not be used for predictive modeling without further validation. Recommended next steps include: (1) detrending both series to remove shared temporal trends before re-assessing correlation; (2) testing at longer lag windows (5, 10, 22 trading days) in Granger causality to capture slower monetary transmission effects; (3) controlling for the VIX or credit spreads as proxies for the 2009 crisis environment; and (4) extending the analysis to multi-year panels (2005–2015) to determine whether the fed funds rate–volume relationship is specific to the zero-lower-bound period or holds more broadly. The moderate r² warrants further exploration, but causal inference requires more rigorous structural modeling.
X dataset: Cboe U.S. Equities Historical Market Volume Data 2009
Y dataset: Federal Funds Effective Rate Daily (FRED)
Part of experiment: Daily - Cboe U.S. Equities Historical Market Volume Data 2009 vs Federal Funds Effective Rate Daily (FRED)