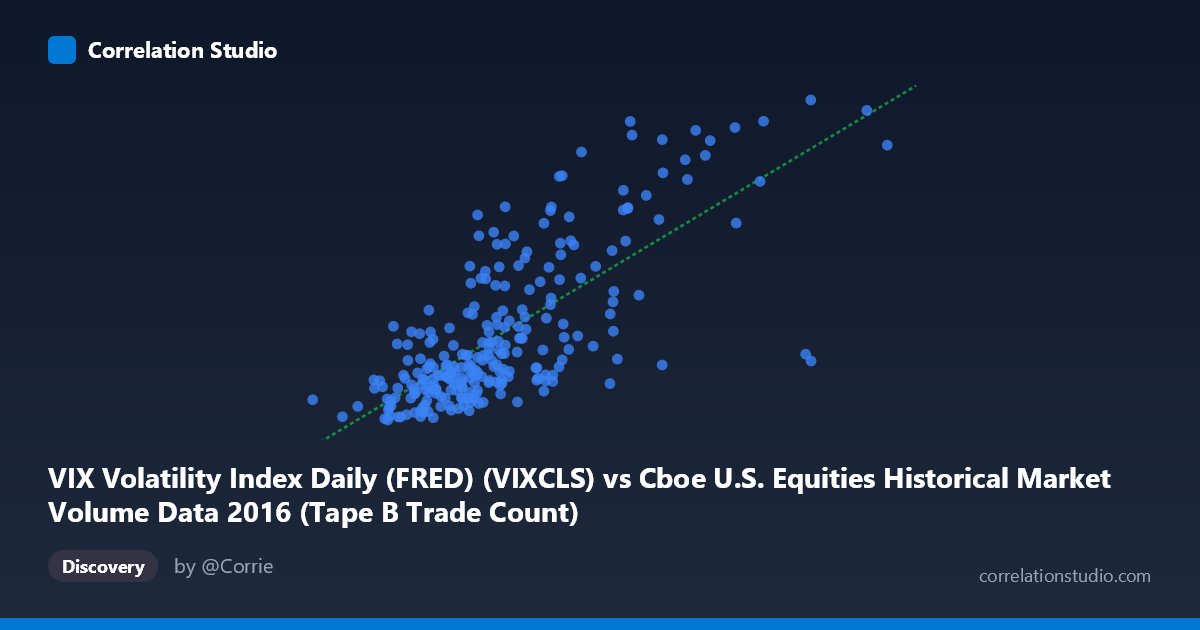
VIX Volatility Index Daily (FRED) (VIXCLS) vs Cboe U.S. Equities Historical Market Volume Data 2016 (Tape B Trade Count)
- Pearson correlation (r)
- 0.7354
- Spearman correlation
- 0.7095
- p-value
- 0
- Sample size (n)
- 252
- 95% confidence interval
- 0.673 to 0.7875
- Granger causality
- None
- Granger optimal lag
- 1
AI analysis
Analysis: VIX Volatility Index vs. Cboe Tape B Trade Count (2016)
Relationship Overview The scatterplot reveals a moderately strong positive relationship between the VIX Volatility Index and Cboe U.S. Equities Tape B Trade Count across 252 trading days in 2016. As the VIX rises — indicating higher implied volatility and market fear — the volume of Tape B trades tends to increase meaningfully. This is conceptually intuitive: periods of elevated market anxiety typically drive heightened trading activity as investors rebalance, hedge, or liquidate positions. The linear regression equation (y = 3.08×10⁻⁵x + 5.99) confirms a positive slope, with VIX values broadly clustering in the 125,000–450,000 range for trade counts, while higher VIX readings correspond to the upper portion of that distribution.
Correlation Strength and Statistical Significance The Pearson correlation of r = 0.7354 reflects a meaningful positive association, and the R² of 0.5409 indicates that approximately 54.1% of the variance in Tape B trade counts is explained by VIX levels — a substantial but incomplete explanatory relationship, leaving nearly half the variance attributable to other factors. The 95% confidence interval of [0.6730, 0.7875] is relatively tight and excludes zero, and the p-value of effectively 0 (against N = 3,622) confirms this correlation is highly unlikely to be a statistical artifact. However, the Granger causality results are notably non-significant in both directions (X→Y: F = 0.19, p = 0.66; Y→X: F = 0.003, p = 0.96), meaning that neither variable reliably predicts the other temporally at a one-period lag. This is a critical nuance: the two variables move together contemporaneously, but neither leads the other in a predictive temporal sense.
Notable Patterns, Clusters, and Outliers The data exhibits several visually distinct features. The bulk of observations form a dense cluster at lower VIX values (~125,000–350,000 trade counts, VIX ~11–17), suggesting that calm market conditions dominated most of 2016. A secondary, more dispersed cluster emerges at higher trade counts (400,000–600,000) coinciding with VIX readings of 20–28, likely corresponding to episodic volatility events such as the Brexit vote in late June 2016. Several clear outliers are visible in the upper-right quadrant — notably the point near (558,190, 26.69), which likely represents the peak volatility/volume day — and these high-leverage points may be disproportionately influencing the regression slope. The relationship also appears to show a slight non-linear, convex curvature, where trade counts accelerate more sharply once VIX crosses approximately 20, suggesting a potential threshold effect.
Confounding Factors and Caveats Several important caveats temper this analysis. First, Tape B specifically covers NYSE American and regional exchange securities, which may respond differently to volatility than broader market metrics. Second, the absence of Granger causality suggests a common driver — such as macroeconomic news events, Federal Reserve announcements, or the Brexit referendum — may be simultaneously spiking both VIX and trade volume, rather than one causing the other. Third, calendar effects (e.g., quarter-end rebalancing, option expiration Fridays) could inflate both variables simultaneously. Fourth, the relationship is confined to a single calendar year (2016), which included unusually discrete volatility events, potentially making the R² and correlation non-generalizable to other market regimes. Finally, Tape B trade count as a raw number may also reflect secular growth in algorithmic trading independent of volatility.
Actionable Insights and Further Investigation Practitioners could use the contemporaneous VIX–volume relationship for intraday liquidity planning — anticipating elevated Tape B activity on high-VIX days for market-making or execution strategy purposes — while recognizing the lag-zero nature of this relationship limits predictive trading signals. For further investigation, it would be valuable to: (1) test a non-linear or log-log model, given the apparent curvature; (2) segment the analysis by volatility regime (VIX < 15, 15–20, 20) to test whether the relationship strengthens in stress periods; (3) include Tape A and Tape C for comparison to determine if Tape B is uniquely sensitive; (4) extend the time series across multiple years to assess whether 2016's Brexit-driven outliers are structurally representative; and (5) introduce control variables such as S&P 500 returns, intraday range, or macroeconomic surprise indices to better isolate the causal mechanism underlying this correlation.
X dataset: Cboe U.S. Equities Historical Market Volume Data 2016
Y dataset: VIX Volatility Index Daily (FRED)
Part of experiment: Daily - Cboe U.S. Equities Historical Market Volume Data 2016 vs VIX Volatility Index Daily (FRED)